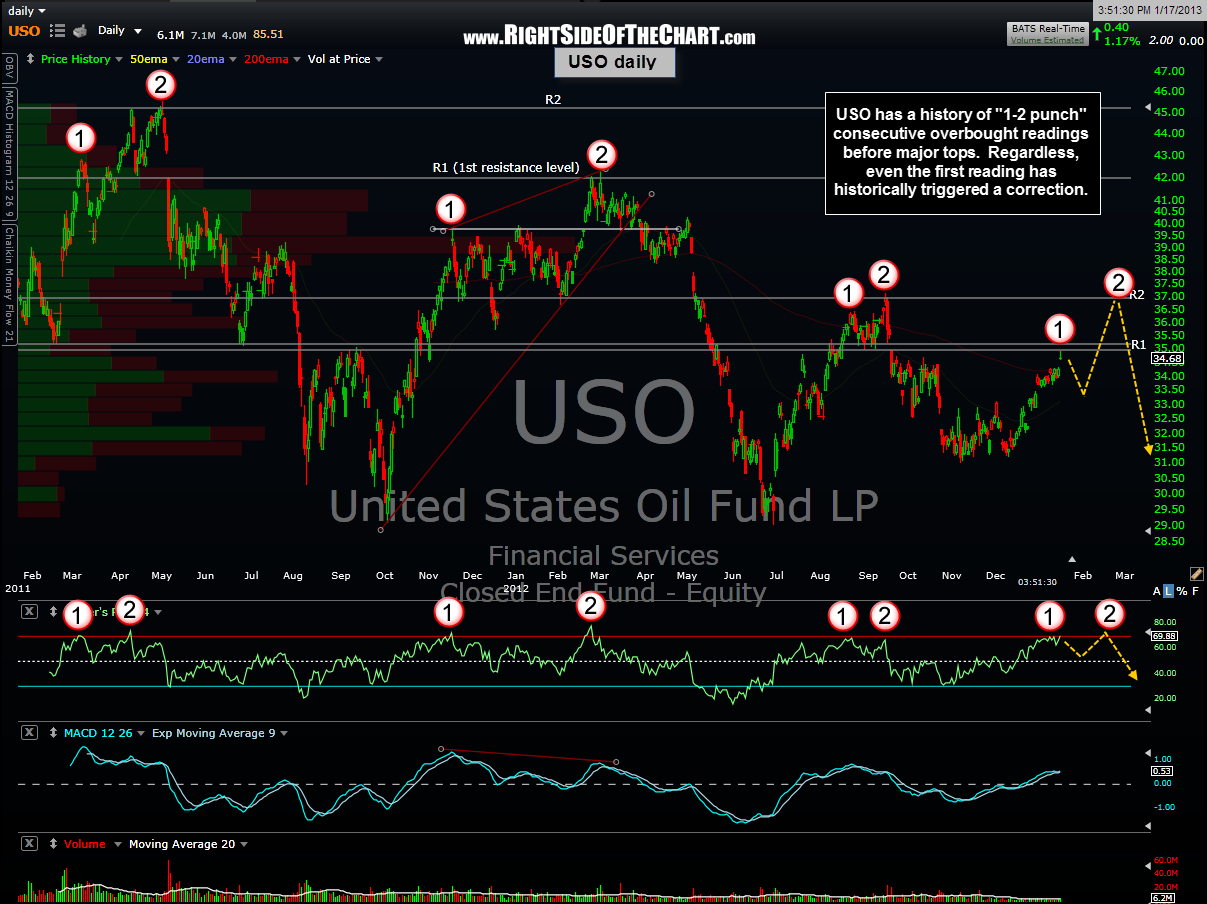
As a follow-up to the previously posted XLE weekly chart (XLE against resistance at the top of the symmetrical triangle pattern), these charts add to the case for a pullback in energy stock from at or near current levels. This daily chart of USO (crude oil ETF) shows prices approaching resistance while reaching rare overbought levels which have typically only occurred about three times per year with every overbought (70+ reading) marking at least a short-term top in crude prices. As the chart below illustrates, the first overbought reading has been followed up by a second overbought reading in relatively close proximity (a few weeks to a few months) with the 2nd reading marking a significant top in USO. Chart patterns never continue to play out indefinitely but if history does repeat once again, we would see a pullback in crude prices from at or near current levels, followed by one last thrust to higher levels and a second overbought reading which would mark a more lasting top for crude.
This next chart simply illustrates the nearly perfect correlation between crude prices (as measure by USO in this example) and energy stocks (as measured by XLE, the SPDRS Select Sector Energy ETF). Note: When viewing price comparisons of two securities in determining price correlations, focus on the trend (up or down) and inflection points. The “drift” between the two securities over time is normal and is caused by over or underperformance between the two securities.


