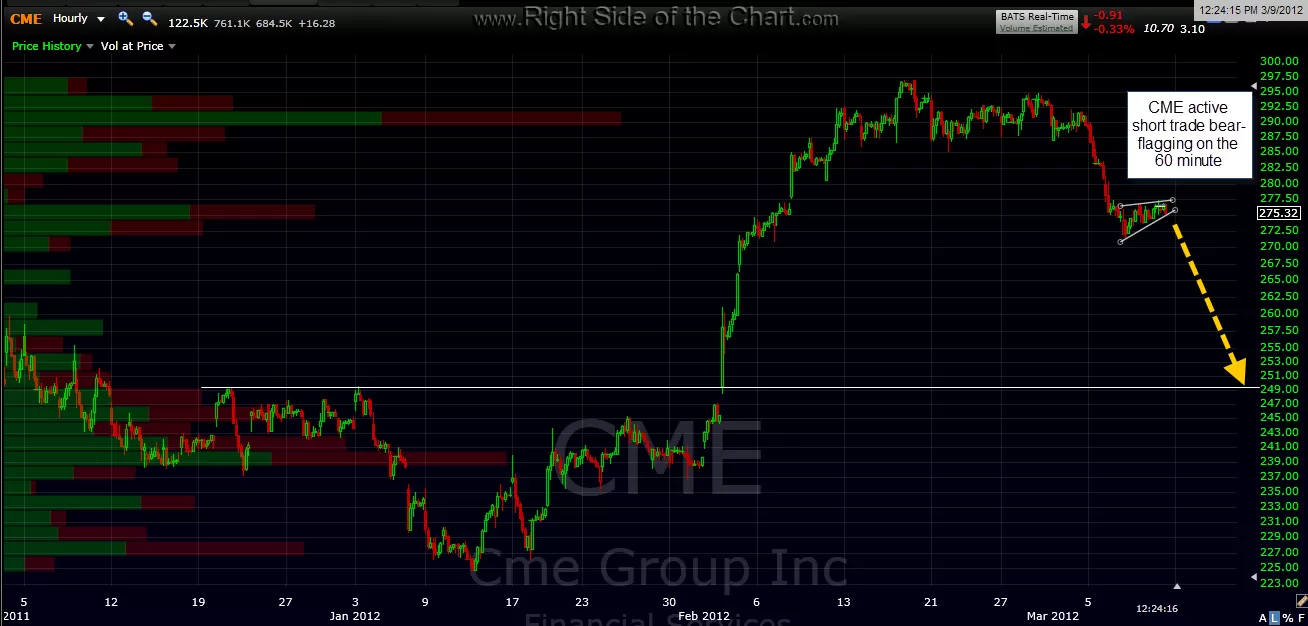
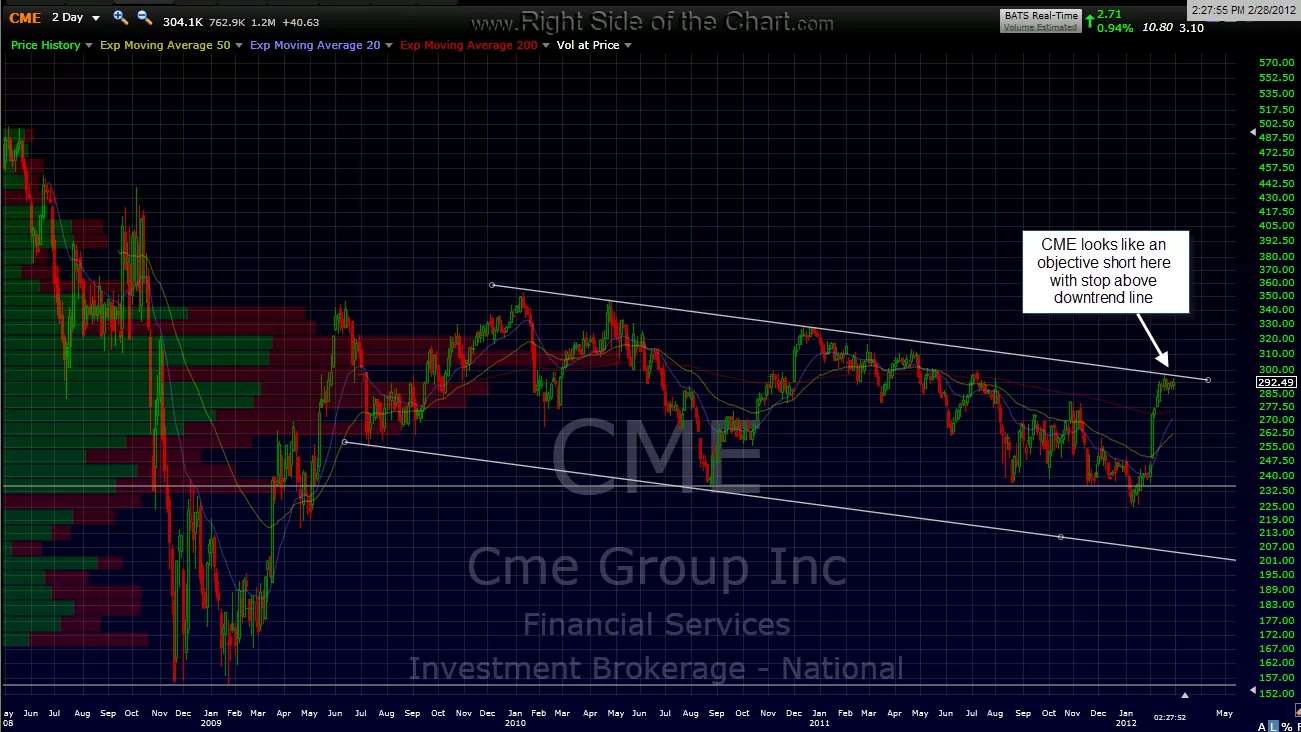
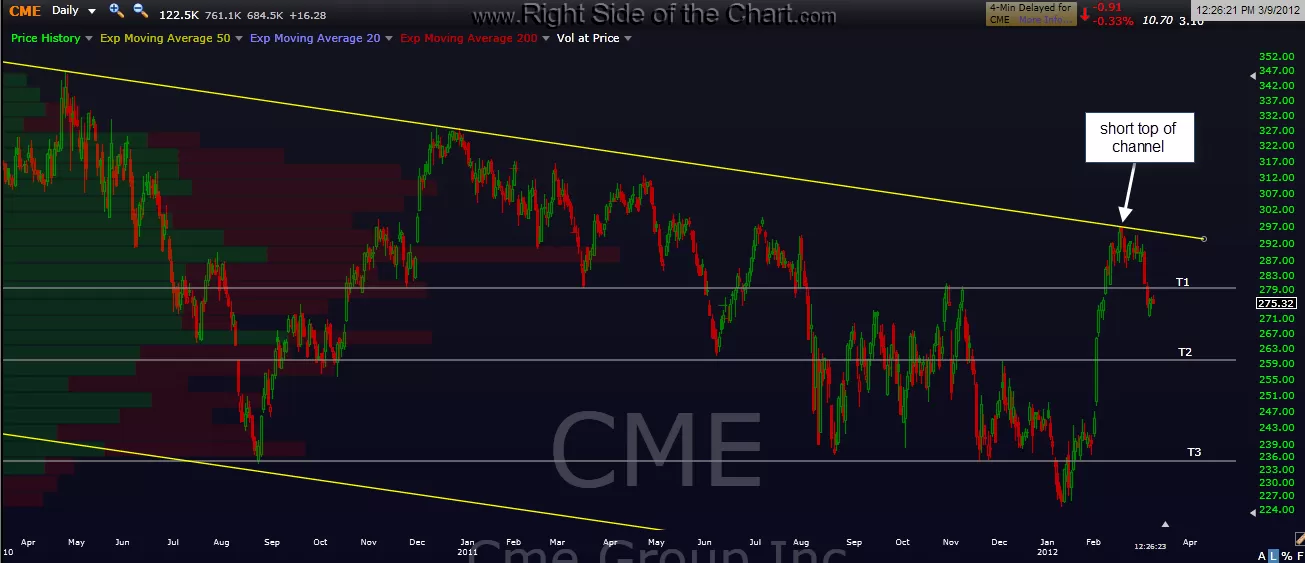
CME appears to be bear-flagging on the 60 min chart. i added a potential target on that frame although keep in mind that T2 from the original daily and 2-day charts is about 10 pts above that 60 min target. current 60 min chart first, then original 2 day chart highlighting the short entry, then an updated daily period chart.

Results for {phrase} ({results_count} of {results_count_total})
Displaying {results_count} results of {results_count_total}