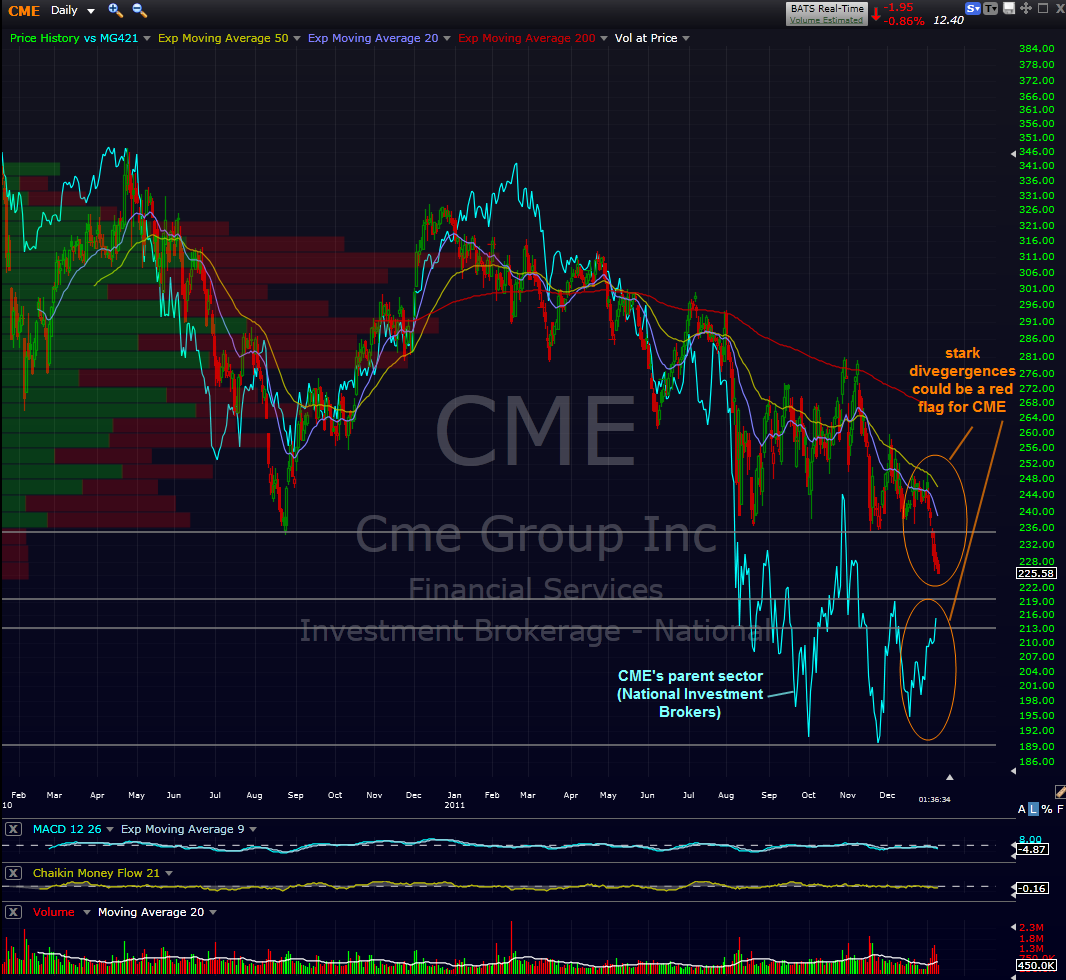
this is not an update on the CME short trade (although it is playing out well but still shy of T1), more so just another reminder to keep an eye on this stock. i know i might sound like dr. doom here lately but i find the fact that CME has not only broken down from key support and high volume (note volume at bottom of chart) but it is doing so in spite of a very strong overall market and more importantly, it’s parent sector. still too early to say it’s anything more than a normal sell-off but due to the importance of the Merc in the global financial system, i do think it is worth monitoring. on a related note, here’s a similar post i made after the MF failure highlighting how these divergences are a red flag. as you probably know, as a member firm of the CME, MF’s financial condition and risk-exposure to their balance sheet was the CME’s responsibility to monitor. maybe the trustee for the MF case will be going after CME for some of the customer losses, hence the selling??
phil- here’s a chart of MF Financial. looks to me …
Posted by: rp on the 1st of Nov 2011 at 02:10 pm
phil- here’s a chart of MF Financial. looks to me like there were two red flags:
#1) it was a sub $5 stock since early sept of this year. stocks under $5 are usually considered highly speculative and actually banned from ownership by prospectus of many mutual funds. fidelity even runs (or used to??) a fund called the “low-price stock fund” that specialized in buying sub $5 stocks… an equity version of a junk-bond fund, if you will.
2) this chart below shows how well MF was correlated to the market in the past but notice the recent divergence between the SPX (blue line) and the XBD (broker-dealer index, white line), just before the sudden BK announcement.
funny how these things happen..
- Open in a New Tab” rel=”prettyPhoto[181575]” href=”http://bpt-images.s3.amazonaws.com/0766745001320171053.png”>


