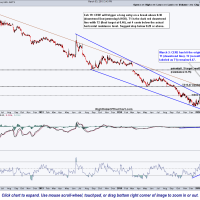
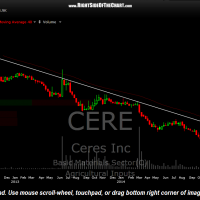
Please note that I had previously incorrectly referred to T1 at the horizontal resistance level at 0.50 (with the suggested sell limit at 0.47). T1 for the CERE trade was originally listed as the primary downtrend line, which was shown on the original daily chart (from stockcharts.com). In the subsequent updates, I was using daily & intraday charts from my TC2000 charting platform which did not show the downtrend line.
- CERE daily 2 March 3rd
- CERE weekly March 3rd
As a reaction is likely on this initial tag of the downtrend line, where CERE is still trading (0.44), the first target has now been hit for a 42% gain since entry & T2 (0.47) remains the second & final official target. Also note that if CERE manages to continue up to the 0.50 resistance level, prices will have broken above the primary downtrend line which further increases the chances that prices will move up to the 0.75 horizontal resistance level over time. My apologies for the oversight.
click here to view the live, annotated daily chart of CERE


