
CERE daily March 2nd
In the last update on the CERE (Ceres Inc) Active Long Trade, a potential bull flag formation was highlighted on the 5-minute time frame. Bull flags are consolidation patterns that typically break out in the same direction leading up to the formation of the flag pattern. The consolidation in CERE has now continued for just over a week and as such, the symmetry for a bull flag pattern on that very short intraday time frame is no longer consistent with a bull flag pattern. However, zooming back out to the daily time frame it would appear that the recent consolidation in CERE following the initial thrust up from the early February lows has all the makings of a bullish pennant.
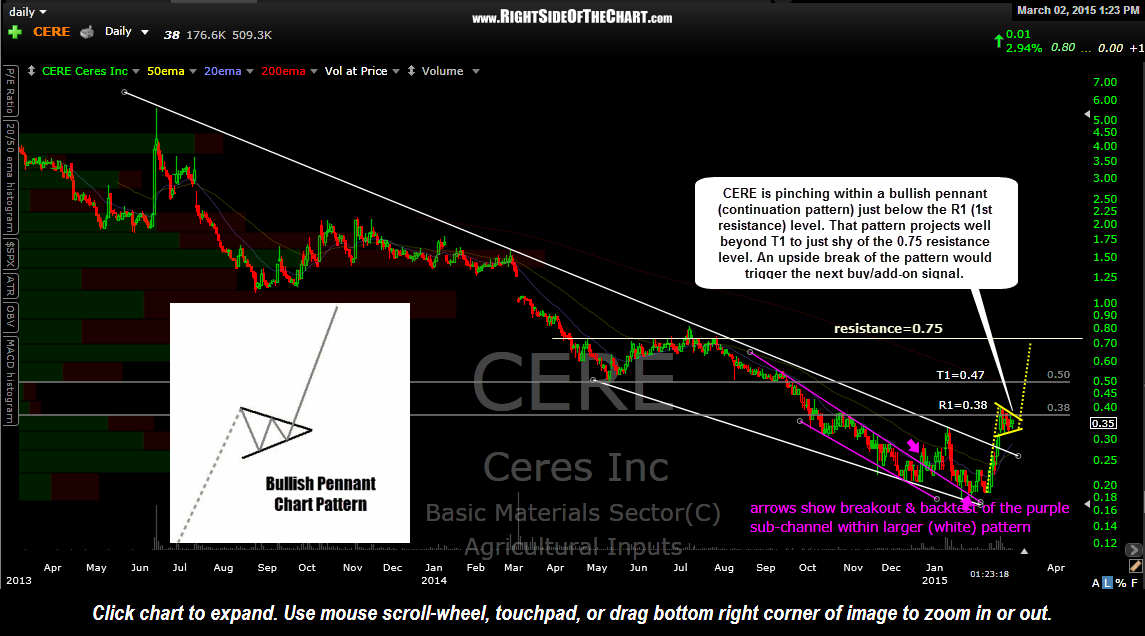
As with Bull Flag Patterns, Bullish Pennant Chart Patterns are continuation patterns that typically break in the direction leading up to the formation of the pennant. The pattern measurement is also similar to that of a bull flag pattern. Although variations for projecting measure moves of chart patterns exist depending on the source referenced, I prefer the simple but effective method of calculating the projected measure move of a bullish pennant by taking the distance of the move (flag pole) leading up to the top of the pennant and adding that distance to the last tag of the bottom of the pennant before an upside breakout of the pattern.
As the dotted yellow lines on this daily chart show, should this pattern prove to play out, it would project a move up to just below the 0.75 resistance level, a potential second target for this trade. However, as of now, T1 at 0.47 remains the first & sole profit target although with the potential for a more lasting bottom in CERE, additional price targets may added depending on how CERE trades going forward.
To reiterate, CERE is a low-priced (penny stock), aggressive trade & as such, consider the proper beta-adjustment to your position size should you determine this type of trade meshes with your unique risk-tolerance & trading objectives.