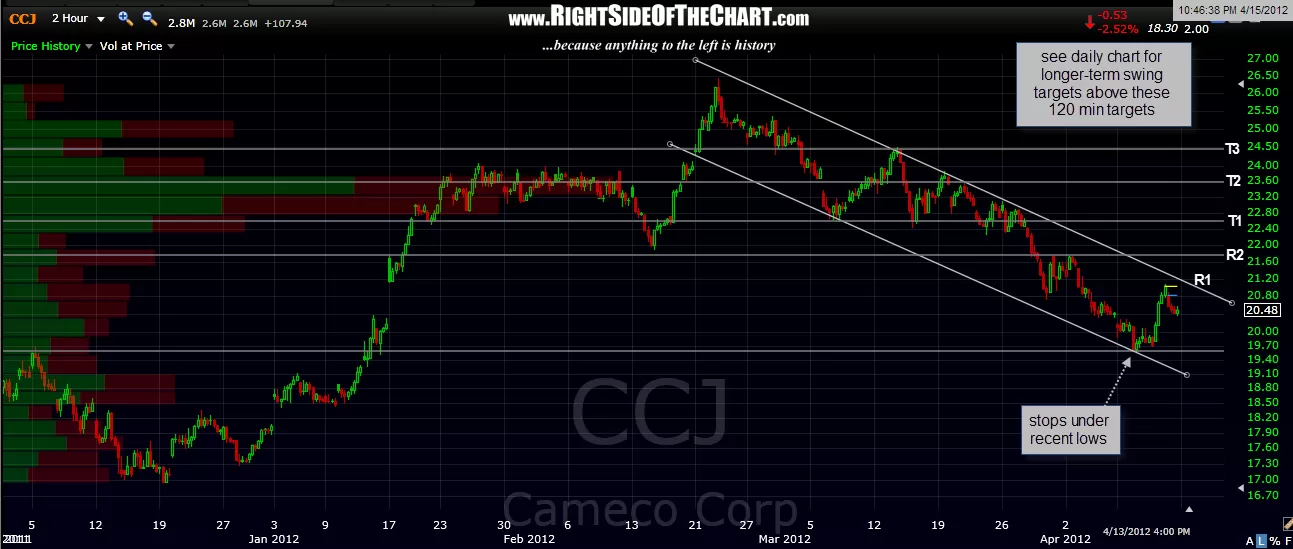
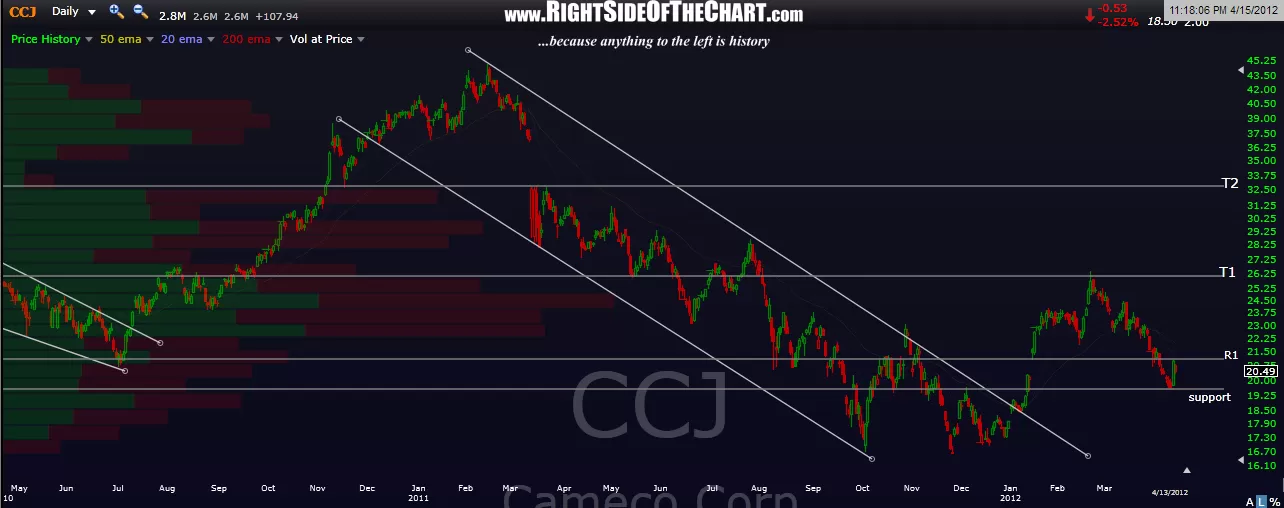
120 min chart below shows the ideal stop level for the trade (just under the recent lows) as well as some intermediate term targets. for longer-term swing-traders/investors, the daily chart shows the first two upside targets along with the same support (stop) area shown on the 120 min chart as well as a key resistance level not far overhead that CCJ needs to clear. first two resistance levels on the 120 min chart are the top of the falling channel, then the horizontal level around 21.80. CCJ should run if those levels are cleared.

Results for {phrase} ({results_count} of {results_count_total})
Displaying {results_count} results of {results_count_total}