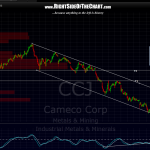
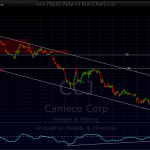
CCJ is approaching the first target recently posted on the 15 minute time frame (2nd chart below). here’s an updated 30 chart showing that prices have clearly broken above that downtrend channel i was tracking and are now close to hitting the first target. note the thin zone on the volume at price histogram to the left of the chart, which should help prices quickly fill that void an hit T2, assuming the market is holding up at the time.
Results for {phrase} ({results_count} of {results_count_total})
Displaying {results_count} results of {results_count_total}


