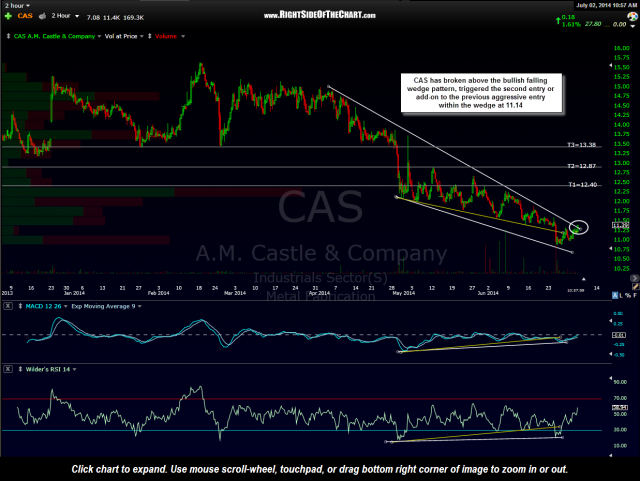
The CAS (A.M. Castle & Co.) active long trade has broken above the bullish falling wedge pattern, thereby triggering the second, more conventional entry or an add-on to the previous aggressive entry that was posted at 11.14 while prices were still inside of the bullish falling wedge pattern. Price targets remain as previously posted.
Results for {phrase} ({results_count} of {results_count_total})
Displaying {results_count} results of {results_count_total}


