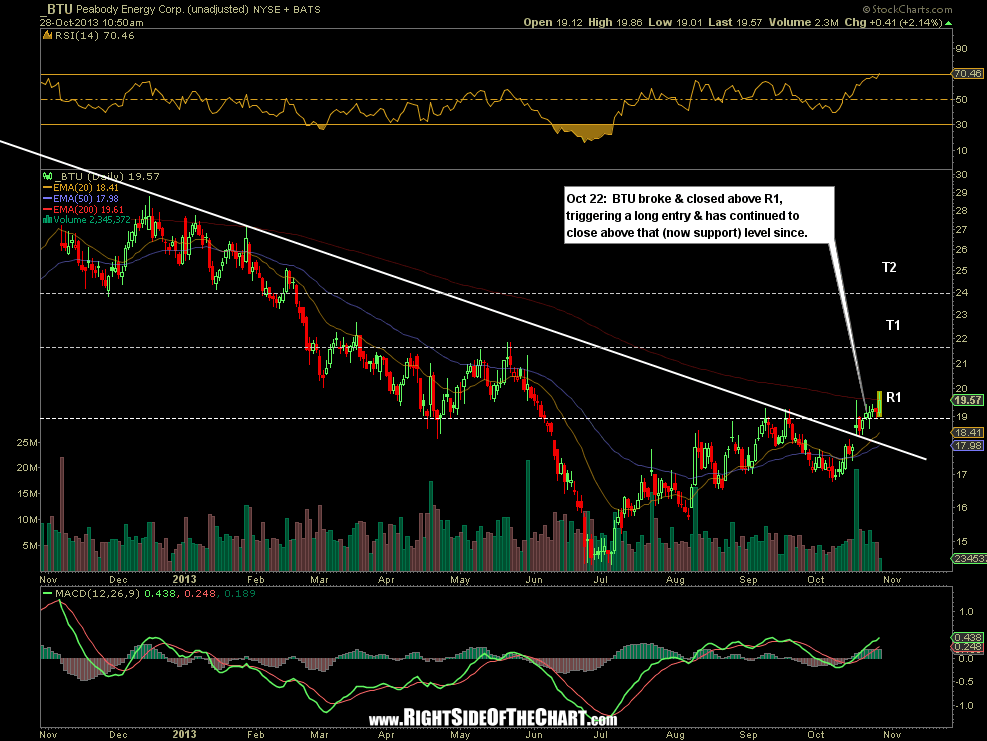
 As a correction to the previous post stating that BTU triggered a long entry today; BTU actually broke above R1 and closed above that resistance level (now support) last Tuesday, the day after the setup was posted. Since taking out R1 early last week, the stock has successfully tested that level every day (bullish price action) and is starting to move higher today. This updated static chart is a 1-year, daily chart while the live chart (click here to view) shows the original 3-year daily chart which covers the span of the important downtrend line).
