
Following the Nov 25th breakdown & sell signal on /BRR, Bitcoin futures) (as well as IBIT), /BRR dropped a bit & then bounced to extended the existing negative divergences on a marginal new high with the next sell signal to come on a break below this minor uptrend line. Previous & updated 120-minute charts below.
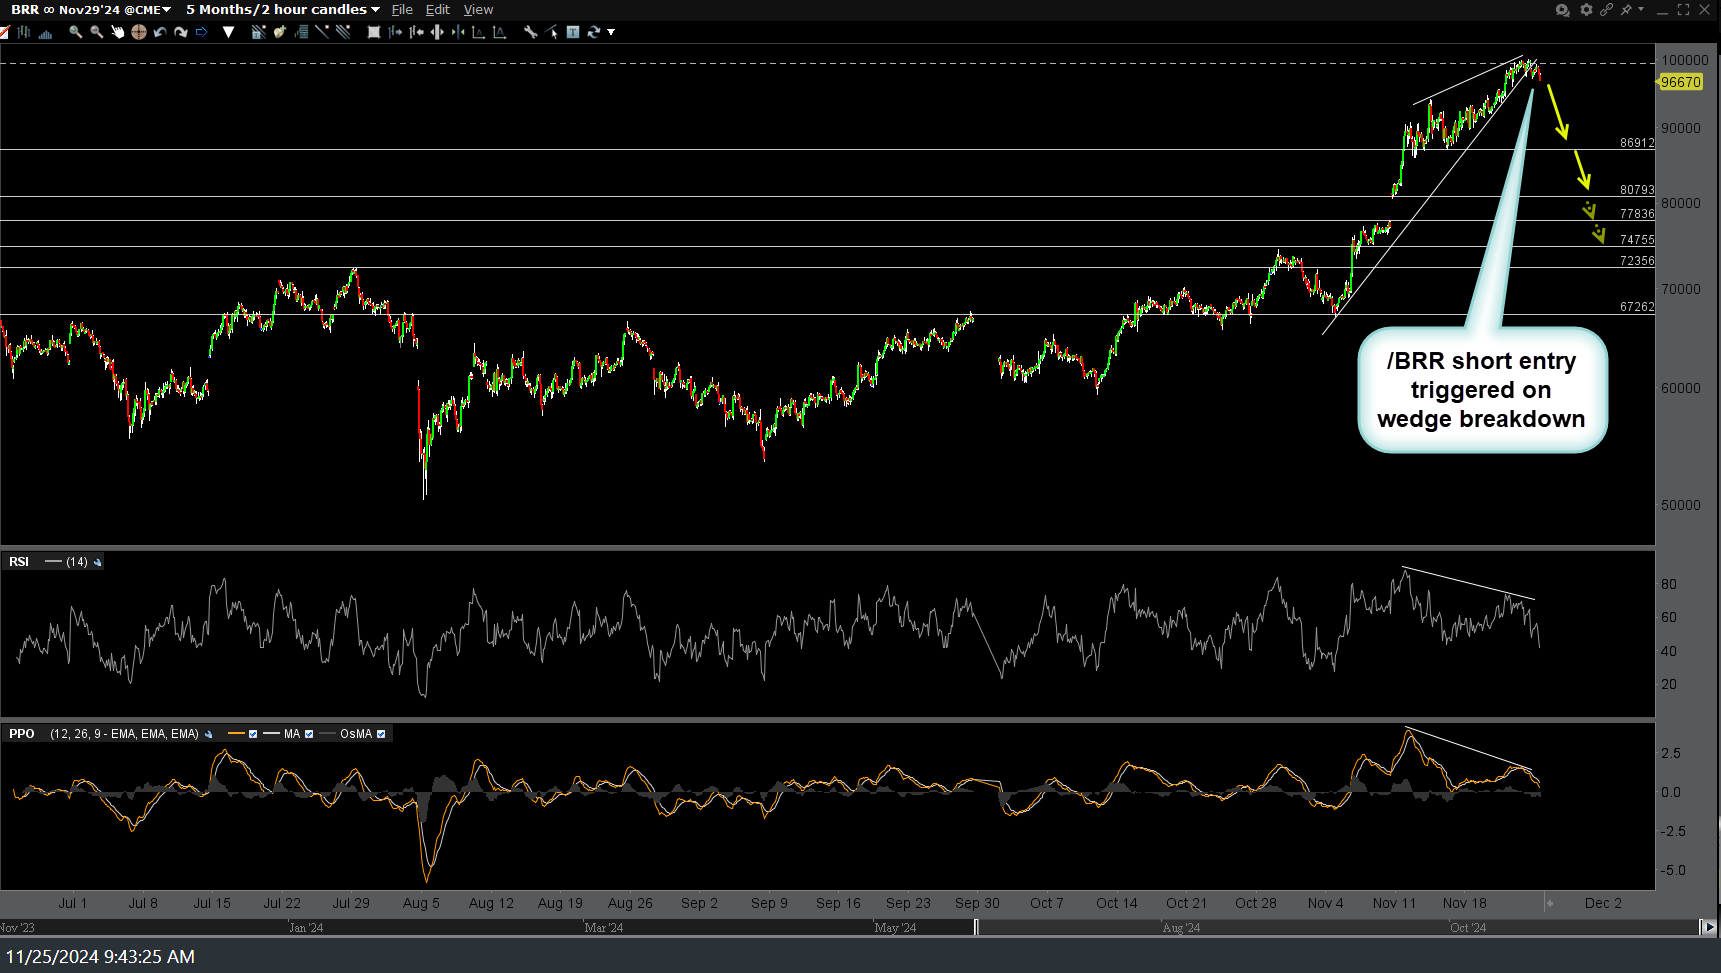
BRR 120m Nov 25th
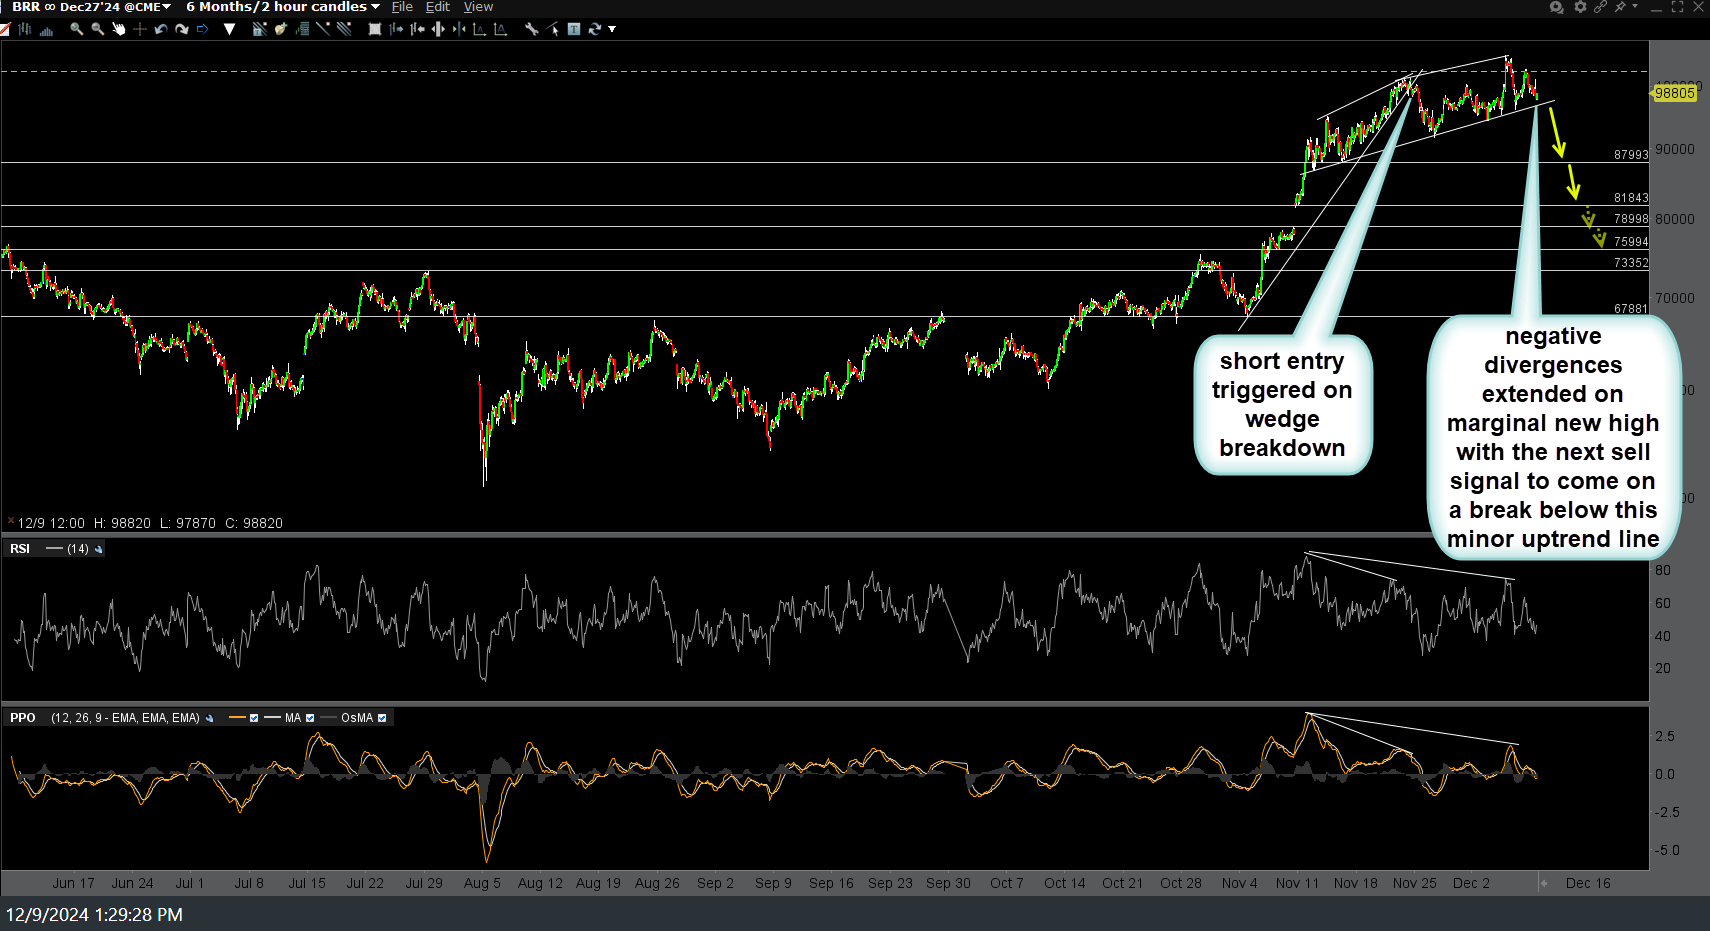
BRR 120m Dec 9th
The bounce that followed the rising wedge breakdown in /BRR was technically induced by the bounce off S1 on IBIT that followed its comparable rising wedge breakdown with the next sell signal on IBIT still to come on a solid break below S1. Previous (Nov 25th) & updated 60-minute charts below followed by the daily chart of $BTC below.

IBIT 60m Nov 25th
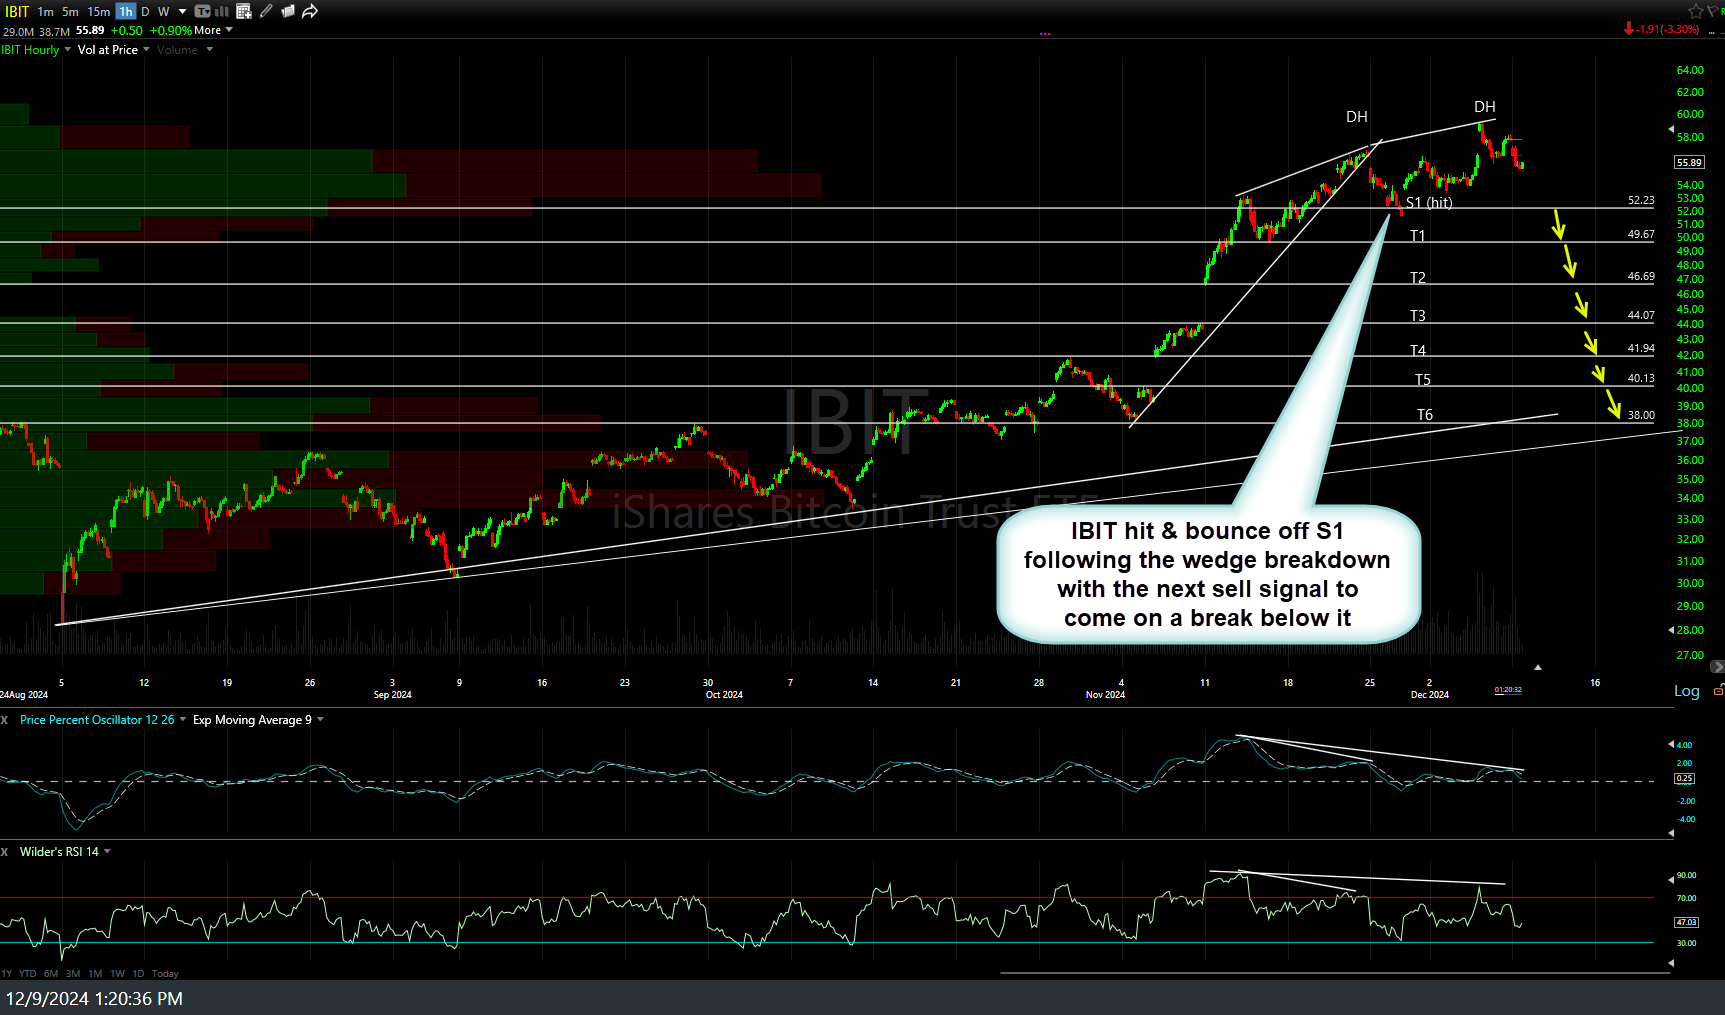
IBIT 60m Dec 9th
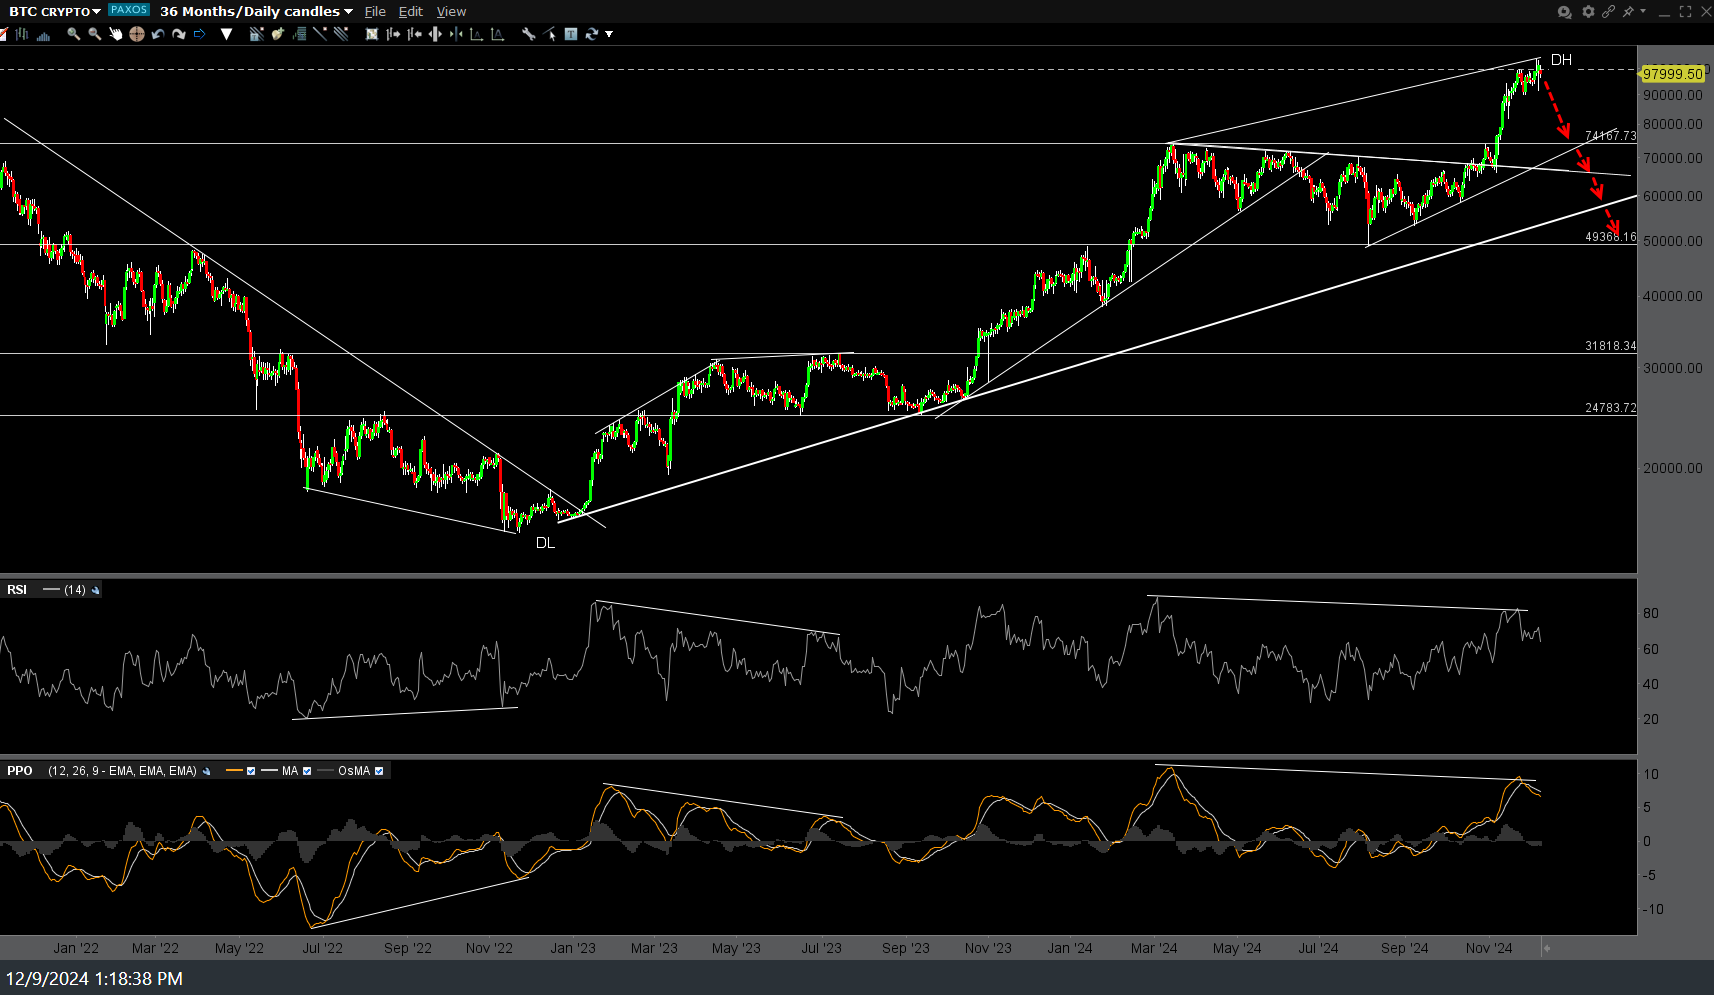
BTC daily Dec 9th