Member @Heinz asked for my thoughts on Bitcoin & Ethereum & although I don’t have a good read on the near-term direction of either, I figured that others might be interested as well & as such, I’d share the charts (with nearby support & resistance levels) here on a new home page post.
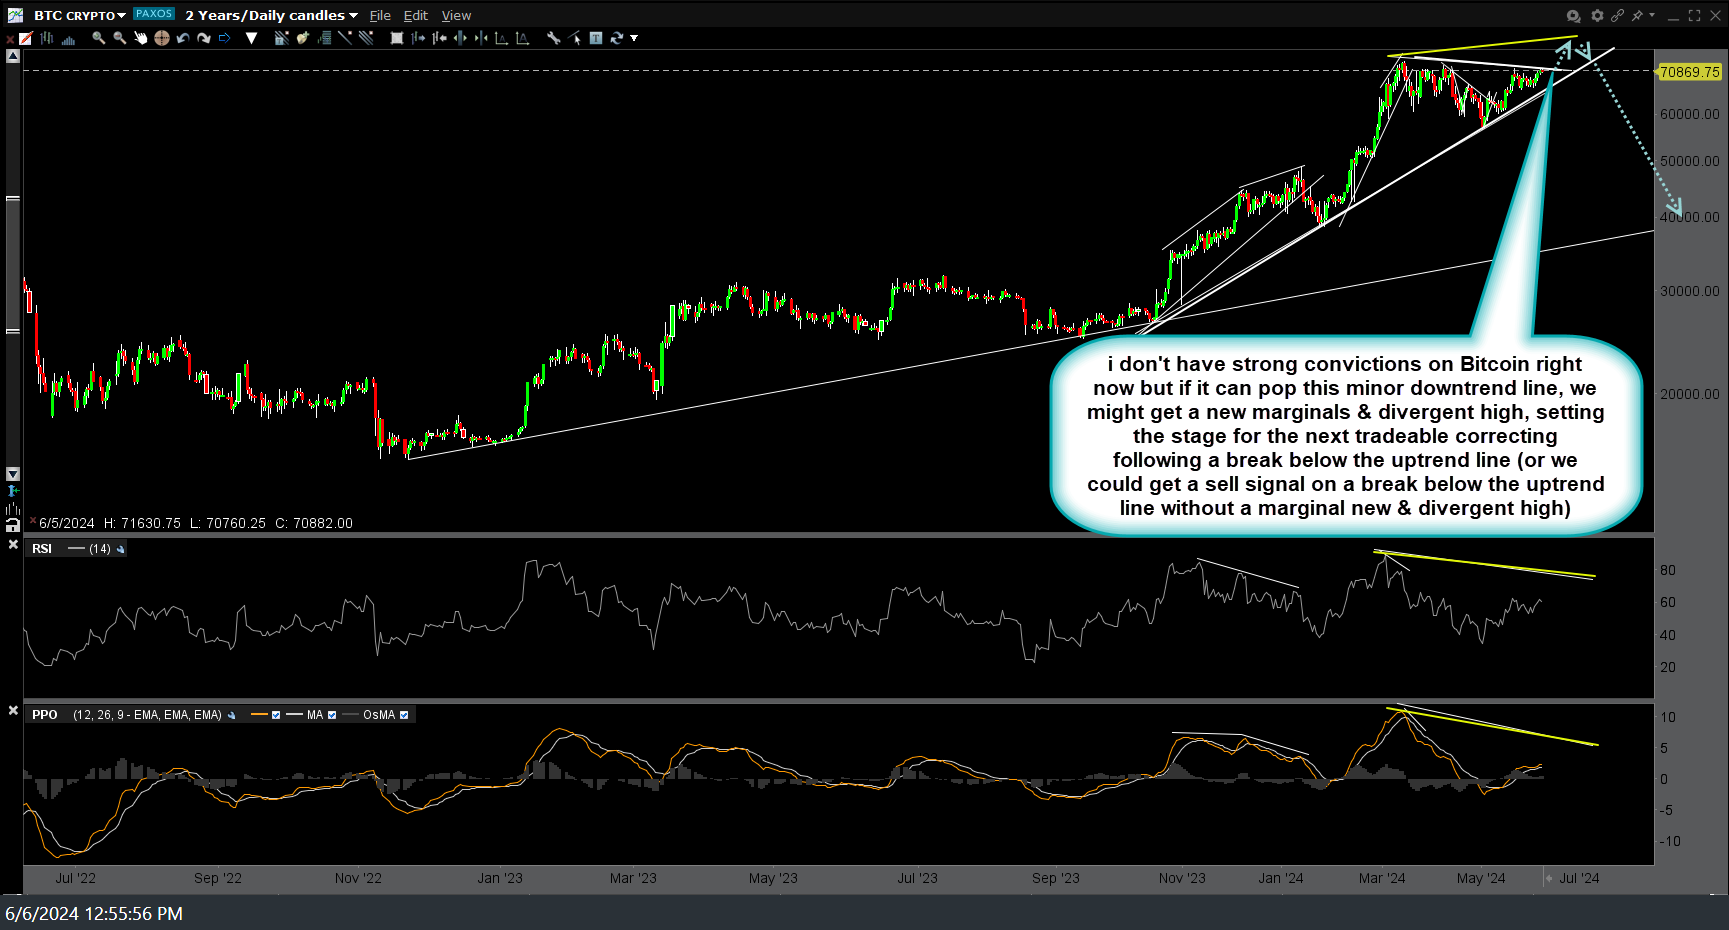
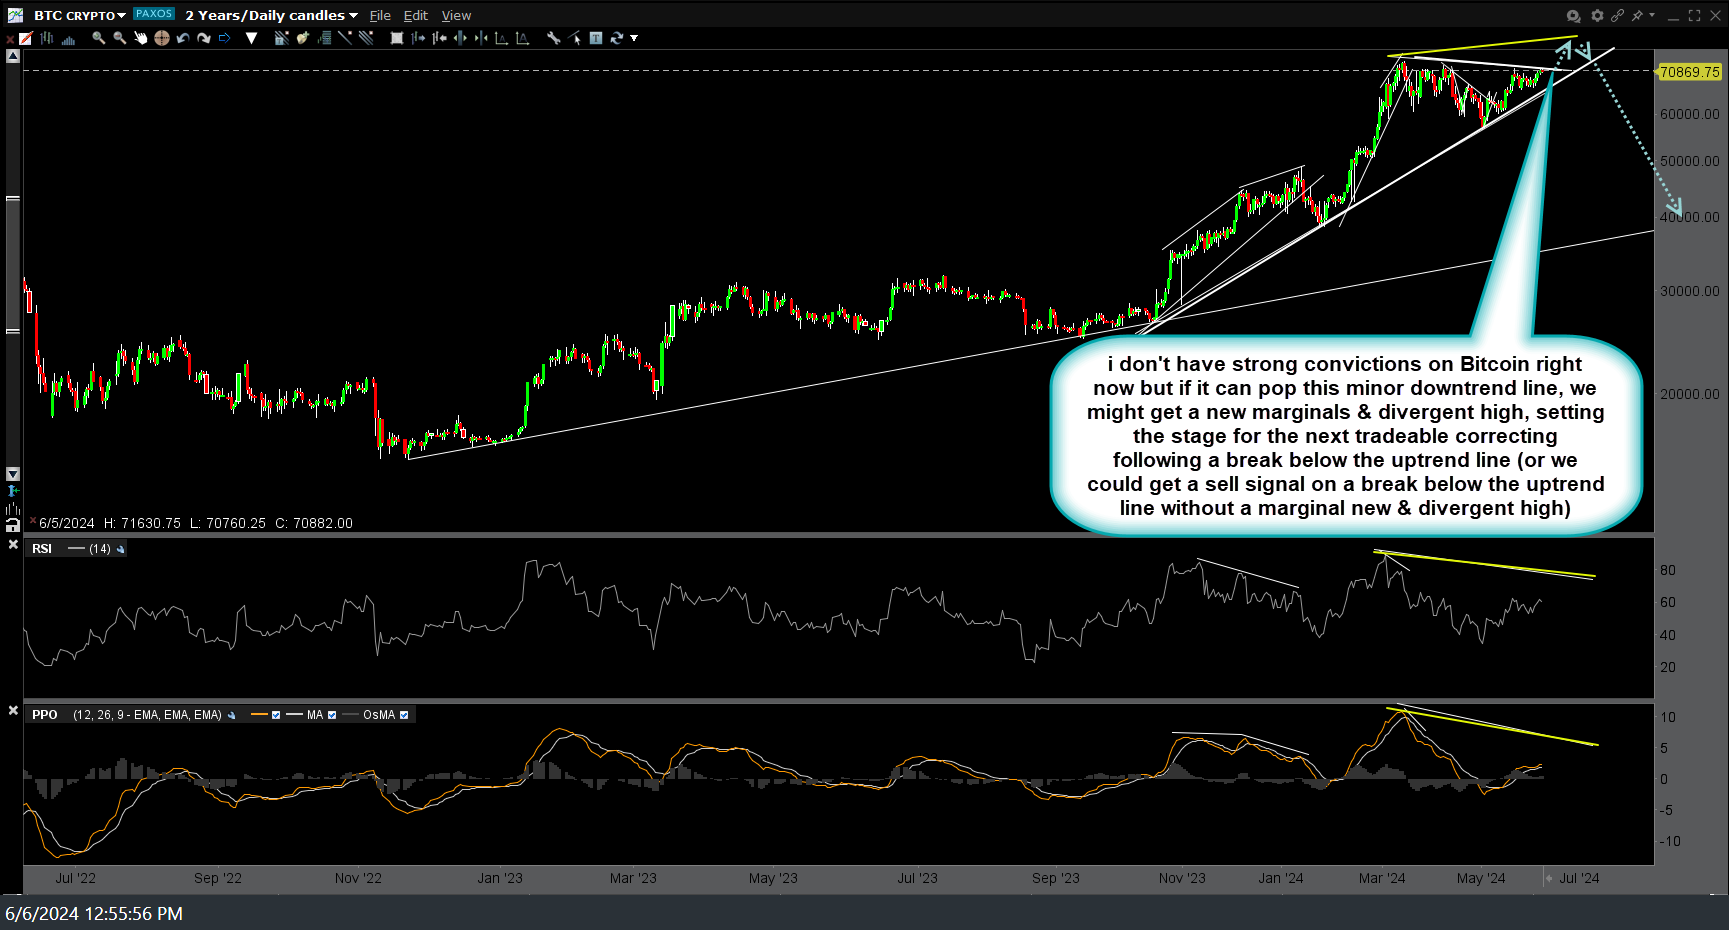
I don’t have strong convictions on Bitcoin right now but if it can pop this minor downtrend line, we might get a new marginals & divergent high, setting the stage for the next tradeable correcting following a break below the uptrend line (or we could get a sell signal on a break below the uptrend line without a marginal new & divergent high). Daily chart (2-year) of $BTC below.
I don’t have a very strong read on the near-term direction of $ETH either although any marginal new high soon is likely to be a divergent high with a sell signal to come below the minor uptrend line and/or the 3715ish support just below. 3-hour candlestick (6-months price history) chart of $BTC below.
As crypto has been a “risk-on” asset recently, trading mostly inline with the stock market, those potentially bearish scenarios above will most likely only play out if QQQ goes on to correct back to the 200-day moving averages in the coming weeks to months.


