
Whether or not /GC (gold futures) makes another thrust higher within this pattern, a break below this bearish rising wedge pattern will likely bring gold down to at least 1309, approximately 1.7% below current levels. Note the rallies & corrections that followed every divergent high & low on this 60-minute time frame. Divergence in itself is not a buy or sell signal but in each of the trend reversals that followed the divergences on this chart, a sell signal was triggered on a trendline break with each of those ‘micro-trends’ terminating in rising or falling wedge-type patterns.
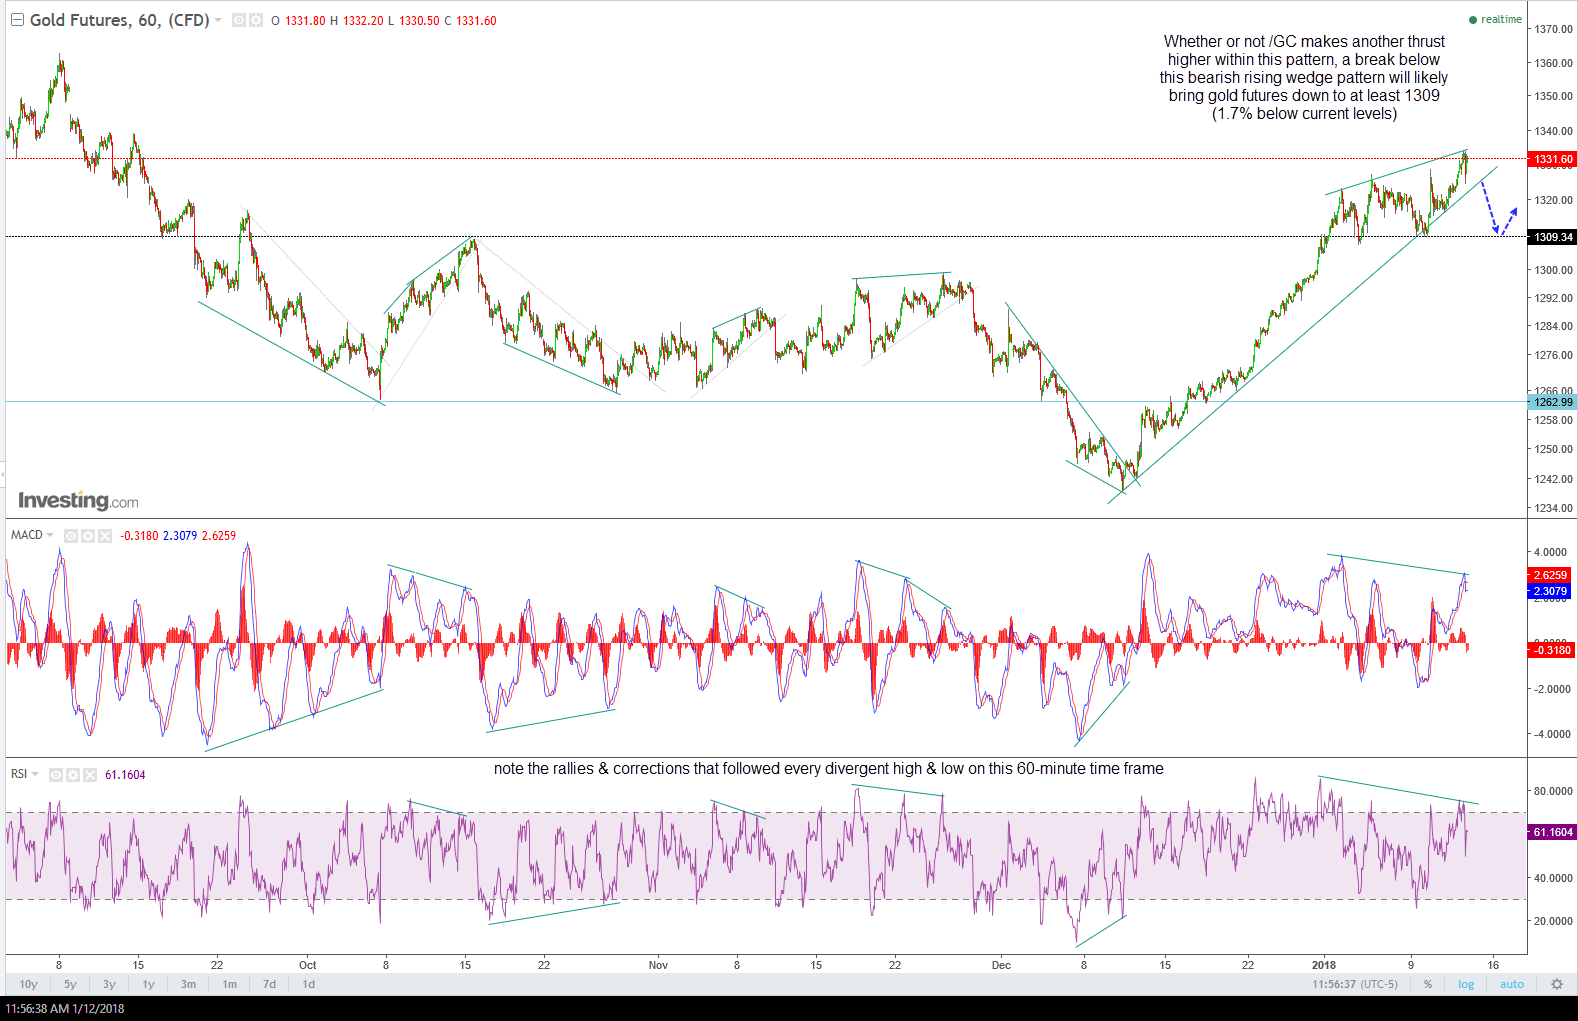
GC 60-min Jan 12th