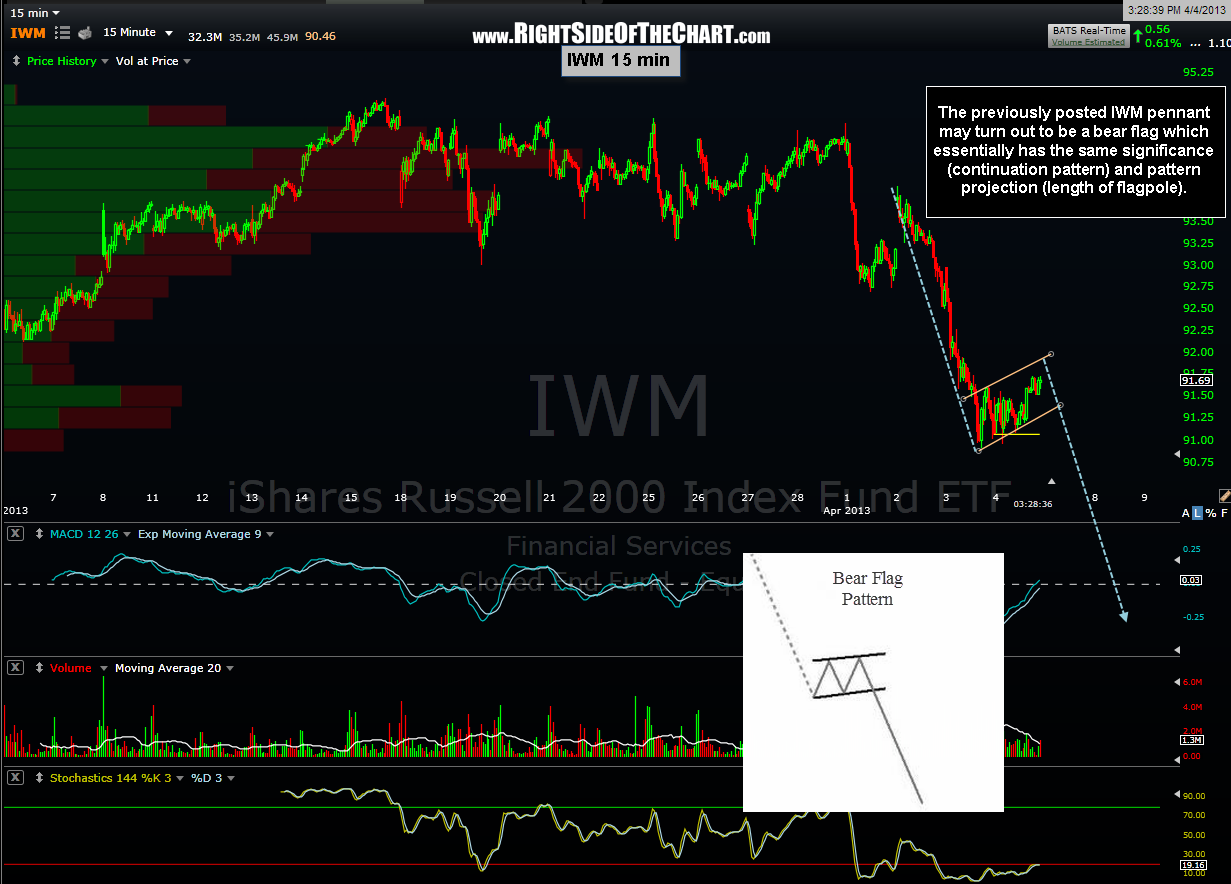
 …half-dozen to the other. The previously posted bearish pennant pattern on the IWM 60 minute chart may very well turn out to be a bear flag pattern instead. For all intents and purposes, these two patterns have the same technical implications. They are both consolidation and continuation patterns that typically form in the middle of a trend and both have the same measured projection which is the length of the flagpole leading up to the pattern. Of course, as with any pattern, we need to see prices break to the downside before the next sell signal is triggered. Even if prices manage to move somewhat above the top of the flag (a technical fake-out/shake-out move), I still think that a downside resolution to the pattern is likely and as such, this looks like an objective area to add to the TZA long/IWM short trade with the appropriate stops in place.
