
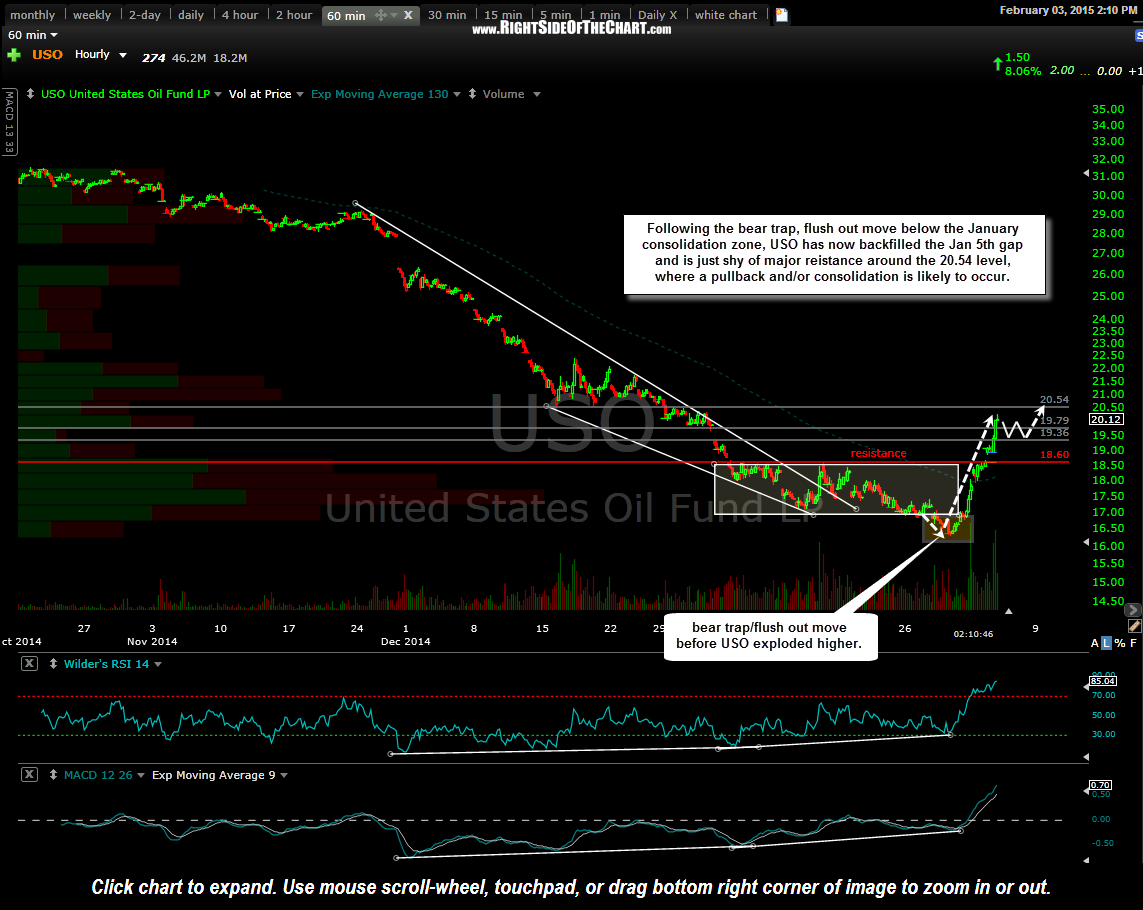
A quick visual on how the recent USO bear trap/flush out scenario from January 23rd (“…at this point I would almost expect a brief breakdown which could serve as a bear-trap & flush-out move.”) has played out. USO has now backfilled the January 5th gap and is quickly approaching the upper-most near-term bounce target listed on the recent string of 60 minute charts. (click on first chart to expand, then click anywhere on the right of each chart to advance to the next chart).
-

- USO 60 minute Jan 22nd

-
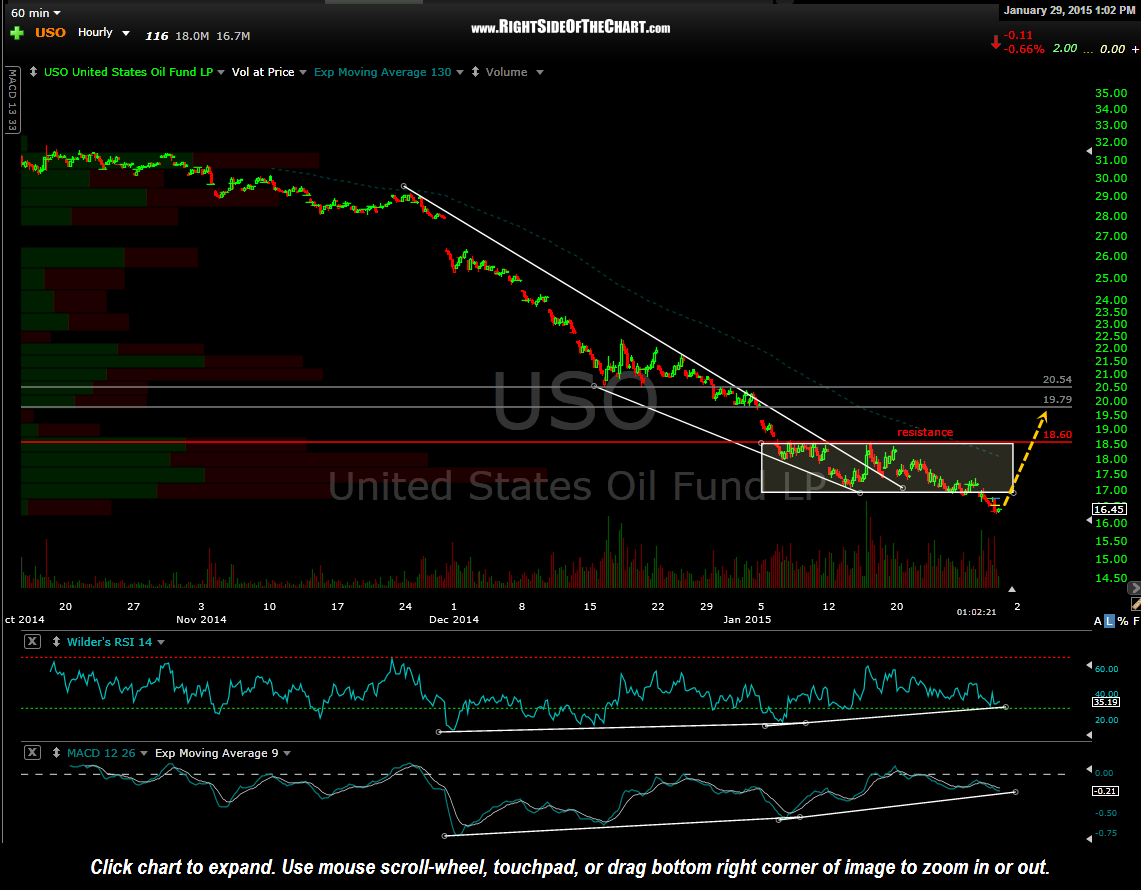
- USO 60 minute Jan 29th
-
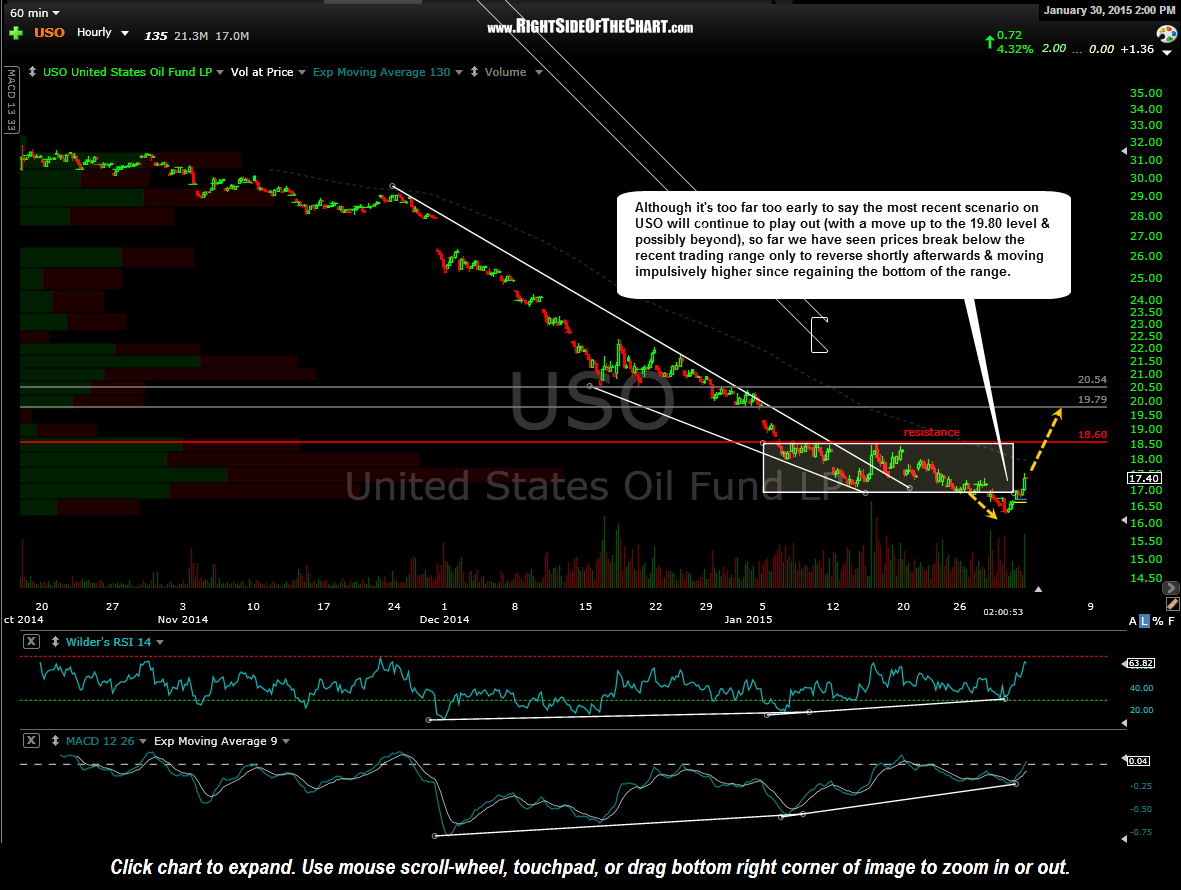
- USO 60 minute Jan 30th
-
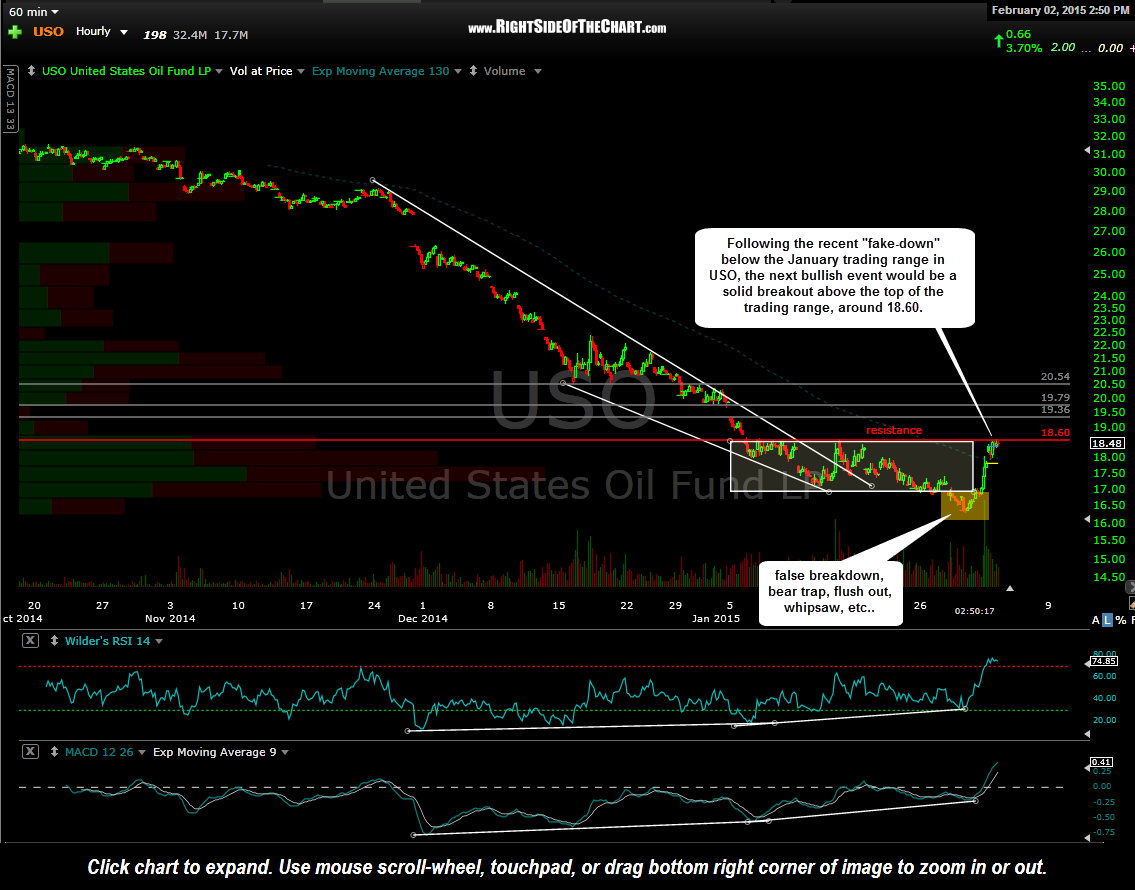
- USO 60 minute Feb 2nd
-
- USO 60 minute Feb 3rd
Personally, I just started reducing exposure to the energy sector & even took a short on crude (via SCO) for a quick pullback/hedge trade as although I believe that the possibility for additional upside on crude oil & particularly, on select energy related stocks with the most bullish chart patterns (even if oil were to trade sideways for a while, which is a possibility), my plan was to quickly capitalize on the initial oversold bounce, book partial or full profits, and then strategically add back exposure if & when I see some objective entries. The chart below is the 60 minute time frame for the March crude futures (CL), showing a fairly solid resistance level just overhead (around 54.20-55ish), which aligns with the 20.54 resistance level on USO.
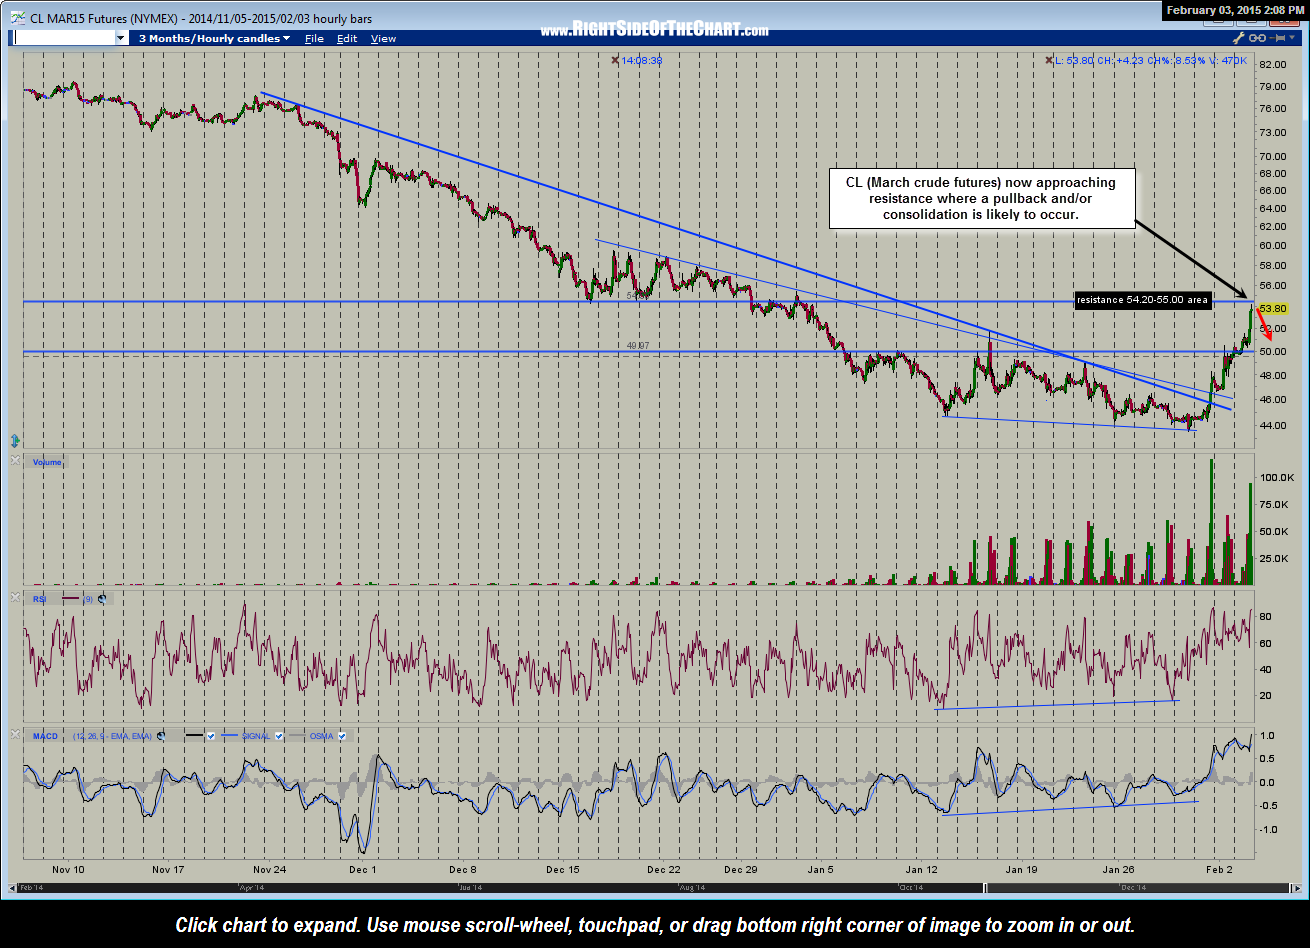
CL 60 minute Feb 3rd