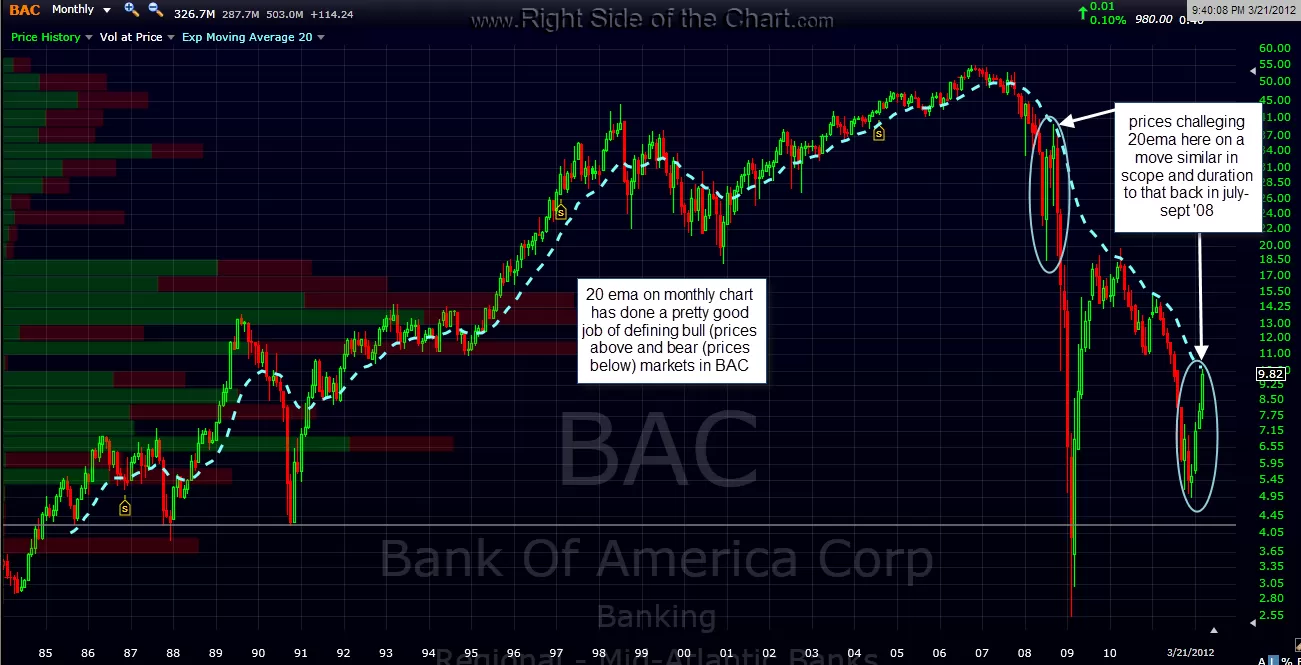
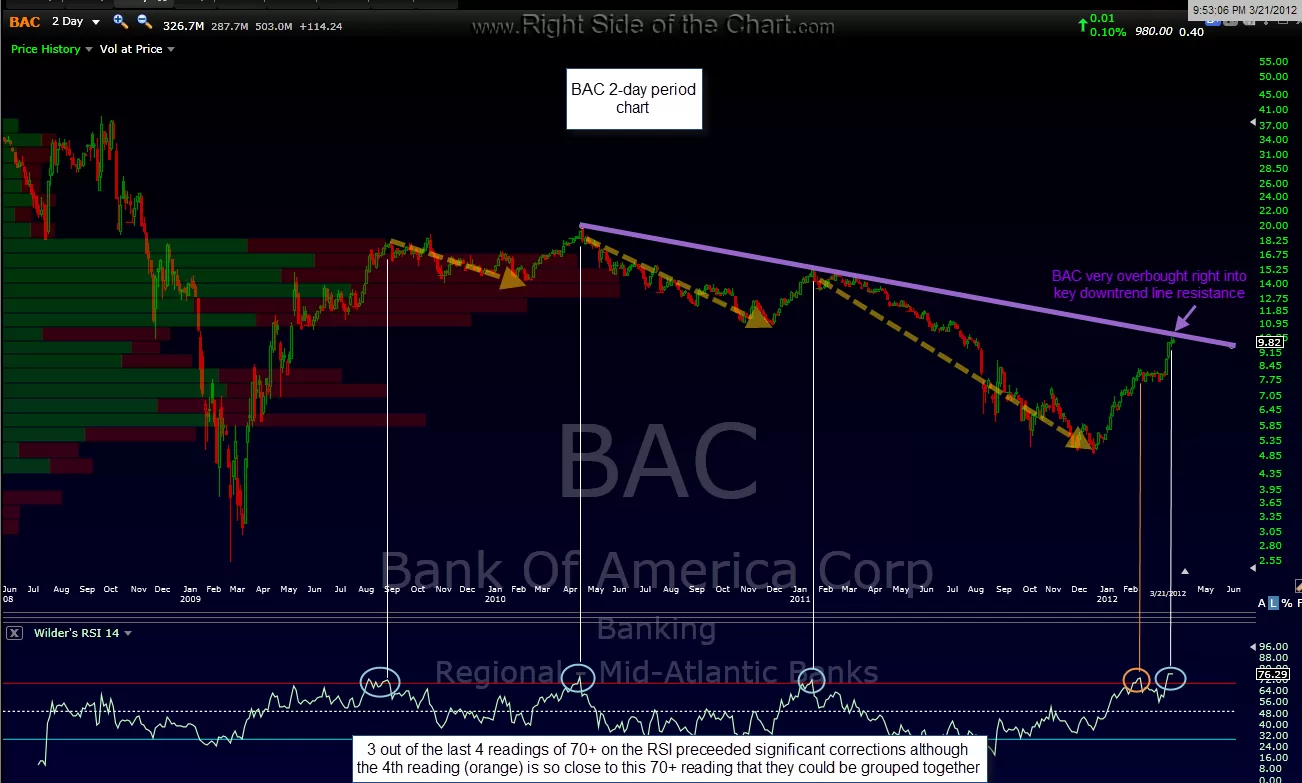
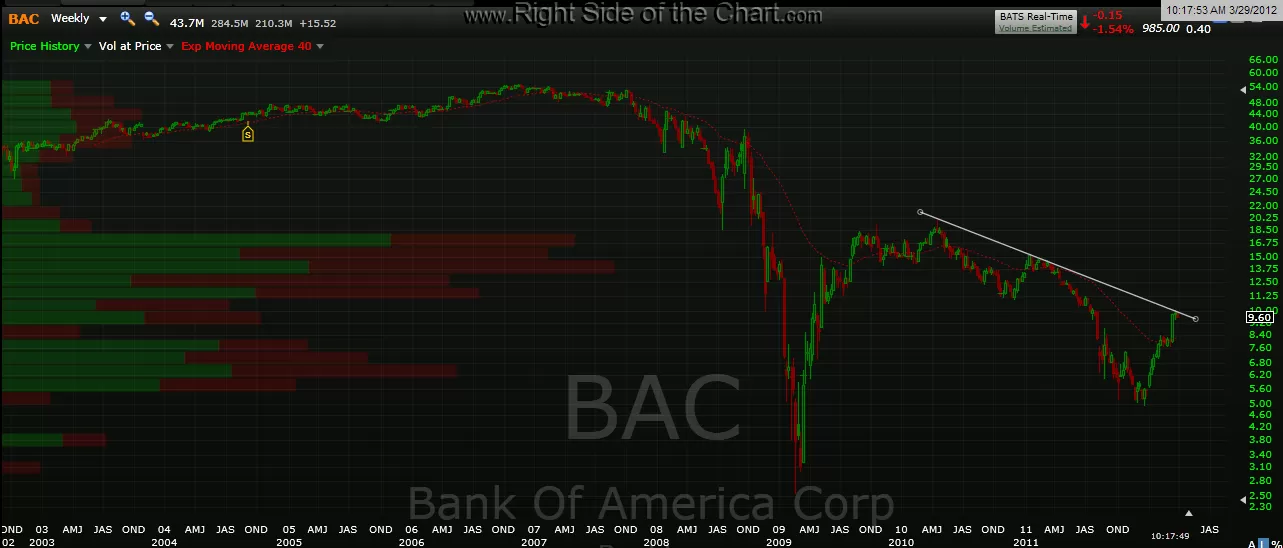
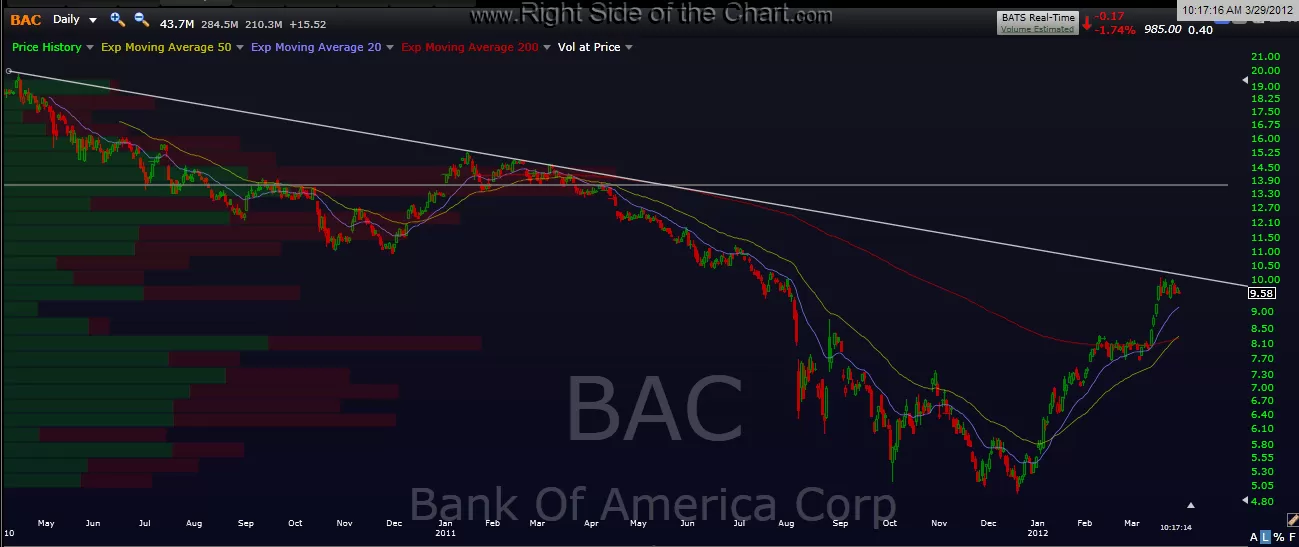
BAC continues to look like an objective short here but one might want to scale into this one as the daily chart shows BAC does have a little bit of upside before hitting that downtrend line that i posted on the 2-day chart the other day (i used a broad line on that one). however, it’s close enough in my opinion to establish a short here or begin scaling in with stops above that downtrend line. the first two charts are the monthly and 2-day charts that were posted last wednesday. the last two charts are the updated weekly and daily charts. BAC is still categorized as both an active trade and a trade set-up as it still provides an objective entry around current levels.

Results for {phrase} ({results_count} of {results_count_total})
Displaying {results_count} results of {results_count_total}