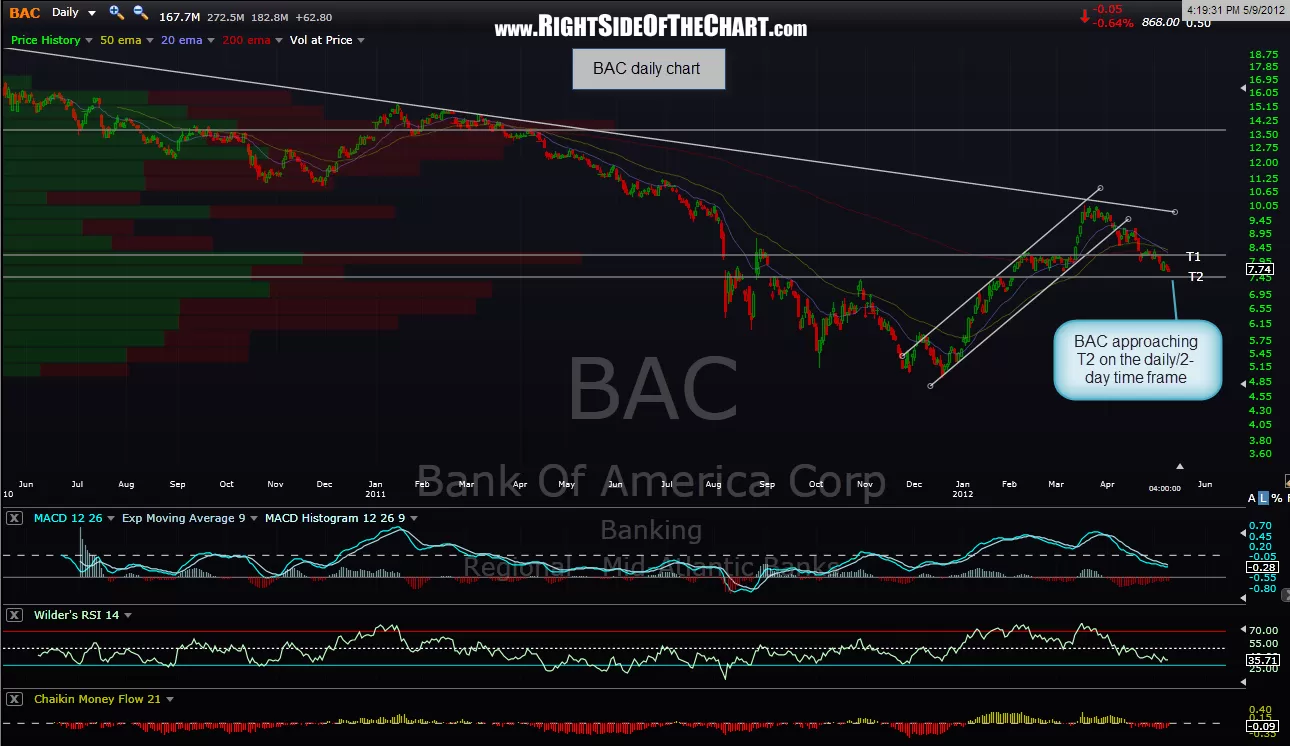
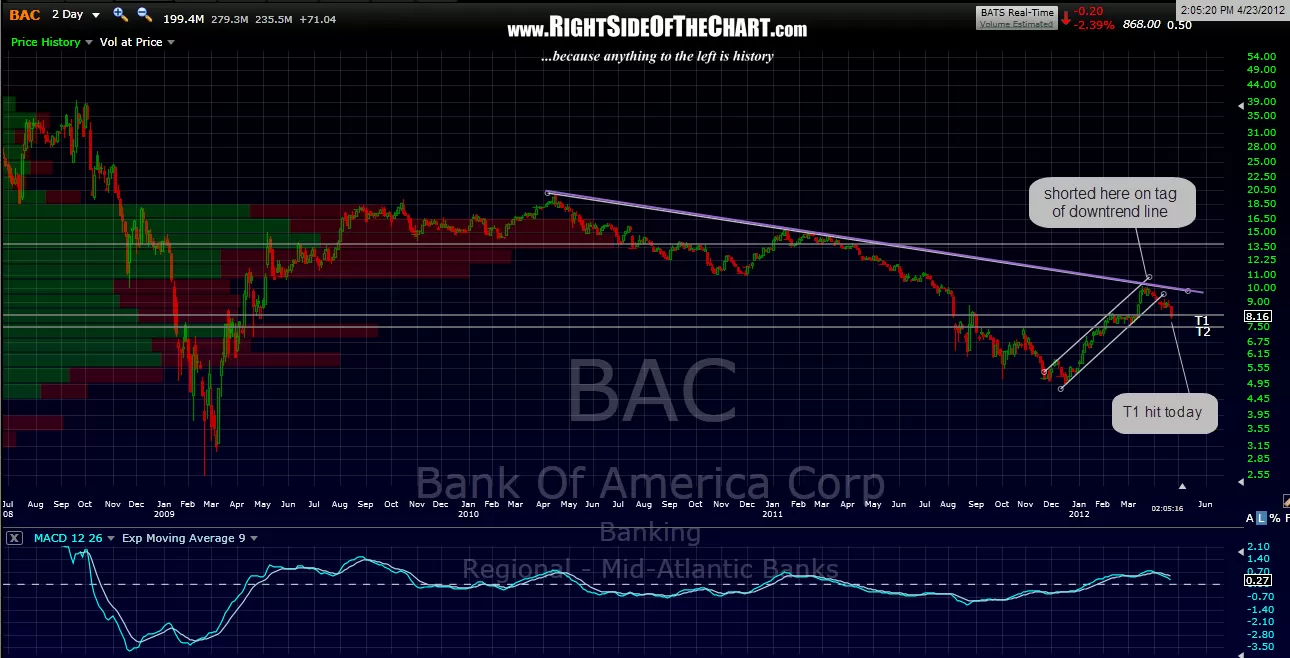
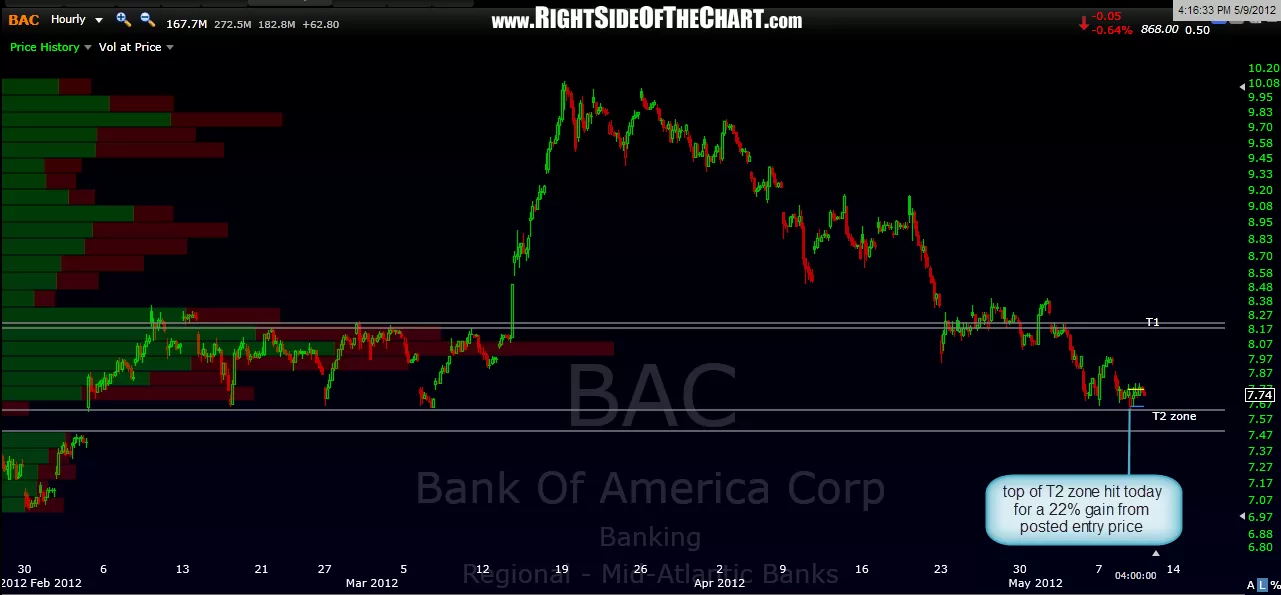
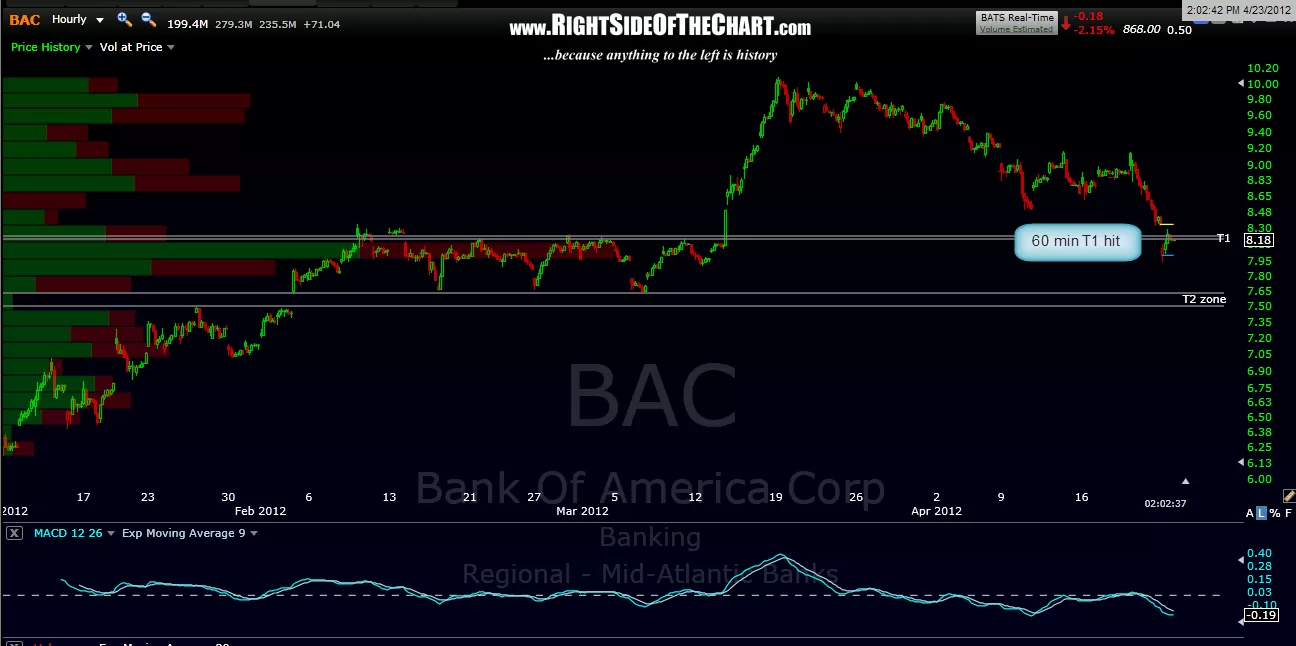
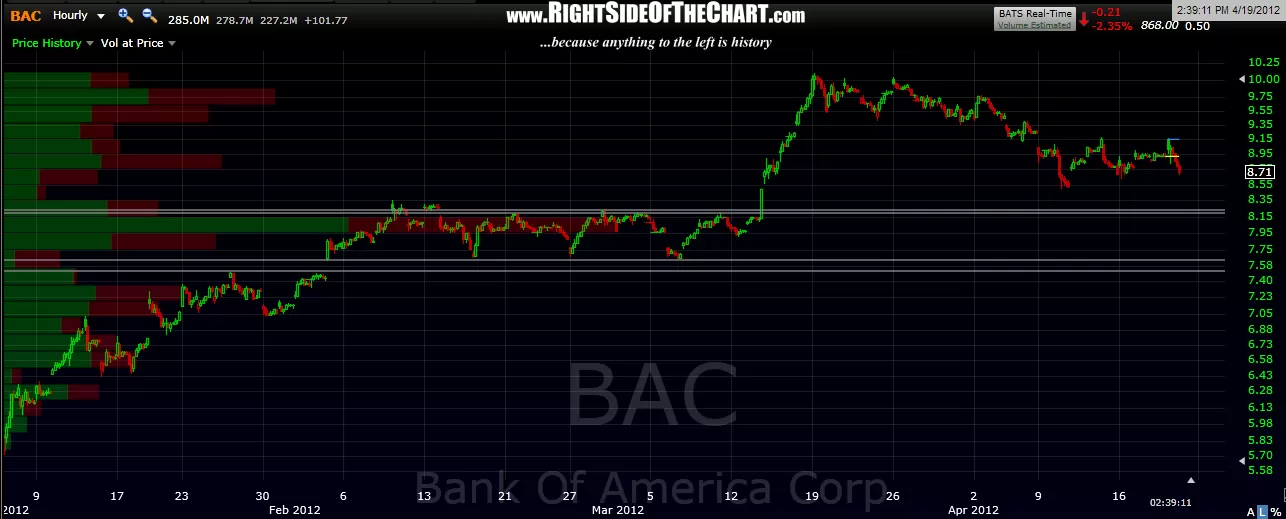
BAC hit the top of the T2 zone on the 60 minute chart today for a 22% gain from the posted entry price so consider taking some profits and/or lowering stops. remember, this trade has similar but slightly different targets based on both the 60 minute time frame as well as the daily & 2-day period time frames. the daily/2-day period target actually the bottom of this 60 minute target zone (7.50 area) but i will often show targets on various time frames as a more active trader might prefer taking the quick profits off the intraday charts while the less active swing trade might prefer to stick with the daily chart, targeting a larger move. i continue to favor these lower targets for the time being and might even add additional downside targets if that support level were to give way. posted below in order are the 60 minute charts followed by the first 2-day period charts and the last chart is a daily chart, which helps show that T2 level a little more clearly for those who want to replicate that horizontal target line.

Results for {phrase} ({results_count} of {results_count_total})
Displaying {results_count} results of {results_count_total}