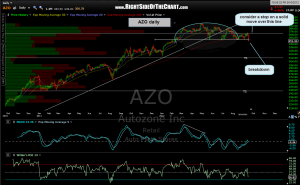
 here’s the updated chart on the AZO short. prices moved sideways out of the originally posted rounded top pattern after giving a false-breakdown and it did run up to test that resistance area that i mentioned in the last update but was unable to make a solid move above it. AZO triggered a fake-down (false breakdown) on an intraday break a few weeks back but prices closed back above that support line that same day. however, on friday, we had a nice fat bearish engulfing candlestick that finally gave us a close below the support line so this one looks good… very good if we get any additional downside and a negative close tomorrow.

