
ASPS (Altisource Portfolio Solutions S.A.) offers an objective long entry here on the backtest of the 32.88-35.20 support zone.Suggested stops for those only targeting T1 (200-day ema) would be on any move below 32.78 while the suggested stop for those targeting T2 (46.90) or T3 (61.43) would be on any move below 31.05 (or the 32.78 level could also be used for a relatively tight stop for those targeting T2 and/or T3).
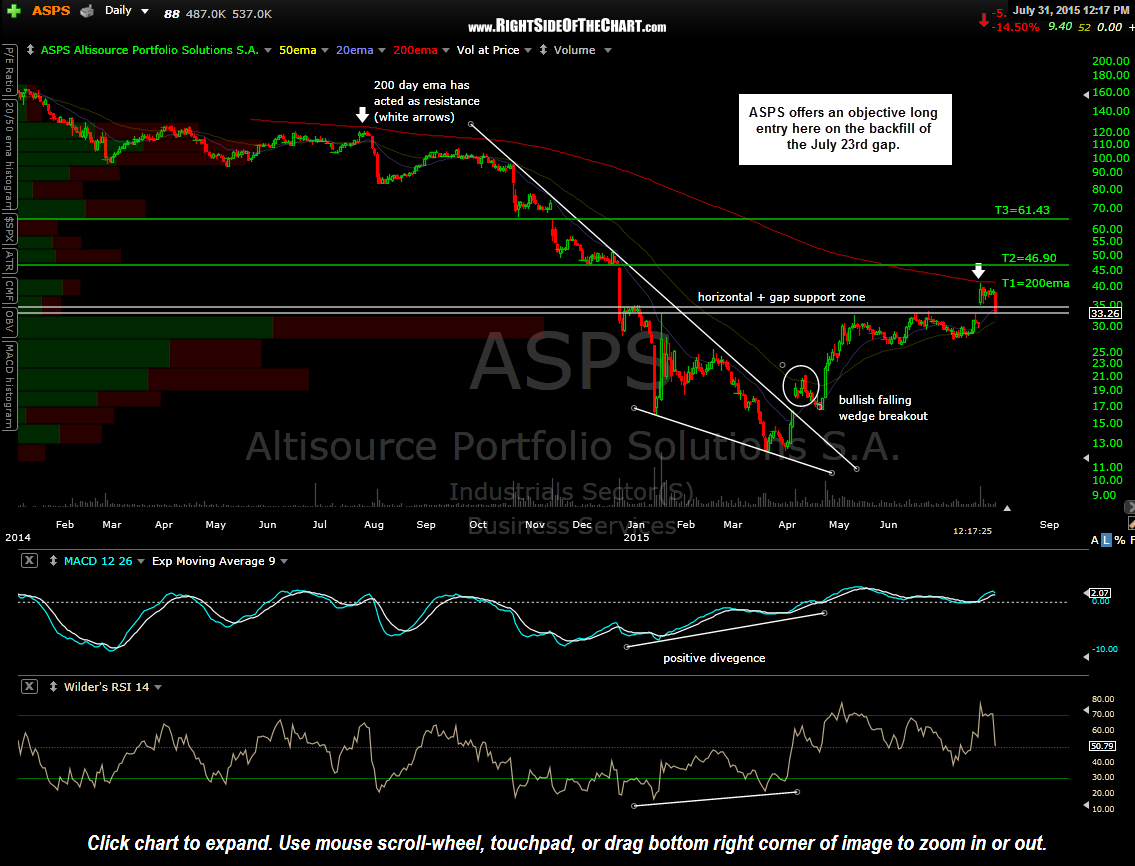
ASPS daily July 31st
The 200-day ema, which has capped all advances since April 2014, currently comes in around 41.29 (about 24% above current levels) although keep in mind that the 200-day moving average is dynamic and will move higher along with ASPS, should this trade play out, therefore providing a gain of well over 25%, if hit). As my price targets are usually set slightly below the actual resistance level in order to minimize the chances of missing a fill, should the stock reverse just shy of resistance, T1 will be set 7 cents below the 200-day ema.
ASPS recently reported earnings on July 23rd so we have a few months to worry about any earnings induced gaps. Due to the above average return potential (80+% gain to the final target, should it be hit), ASPS will be added as both an Active Long Trade (i.e.- swing trade) as well as a Long-term Trade (trend trade/investment). Although the stock is trading down sharply today, this trade does offer an extremely attractive R/R with minimal downside if stopped out and relatively large profit potential.