
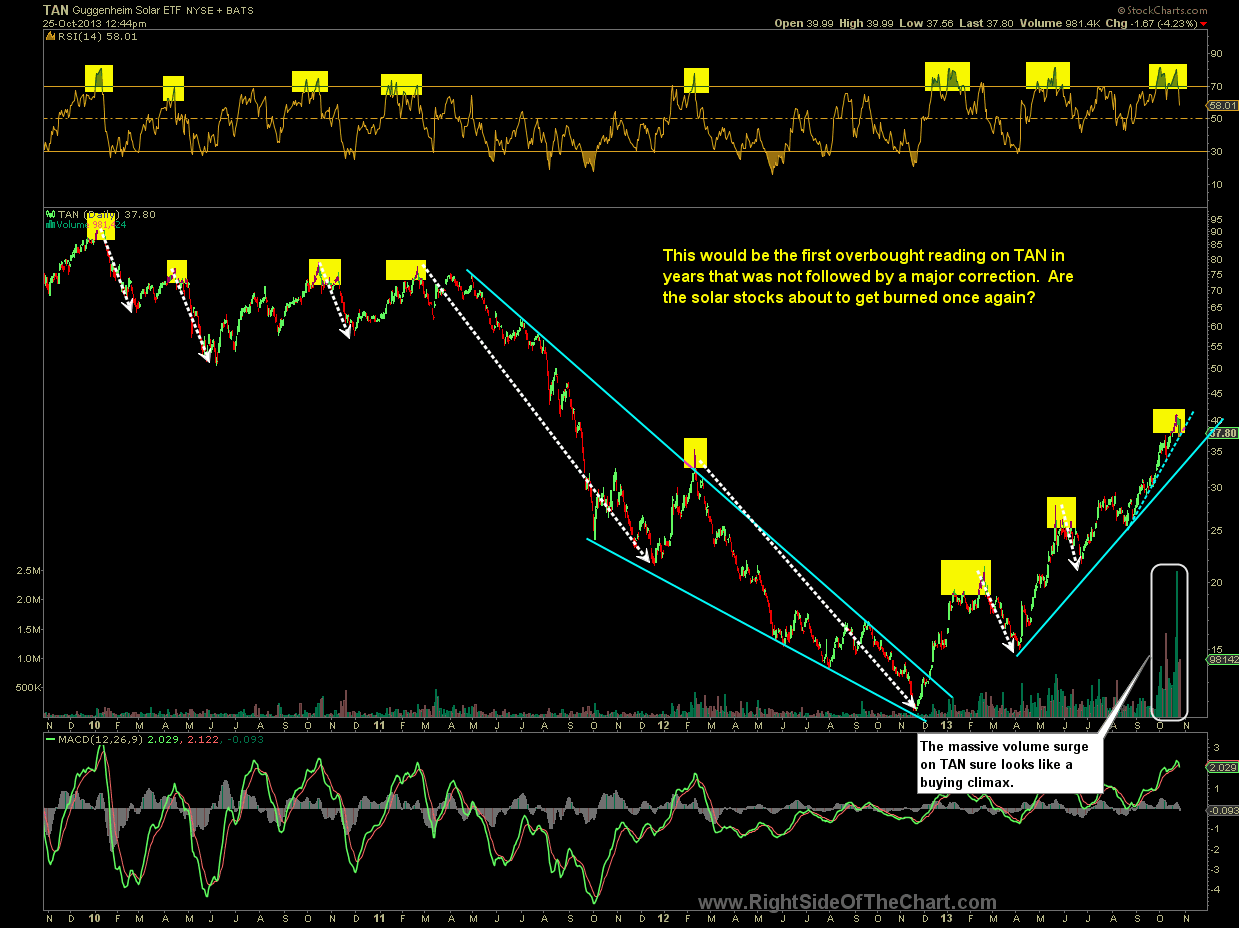
 As mentioned in the GTAT short setup posted earlier, I’ve found several attractive short candidates within the solar sector that, at the very least, look ripe for a quick, overbought pullback. As the solar stocks are very volatile and daily price swings in the double-digits are not uncommon, consider adjusting your position size accordingly to adjust for the larger than normal profit potential and above average stop loss allowance needed to successfully swing trade these stocks. This is a 4-year daily chart of TAN, the Guggenheim Solar ETF showing how every overbought reading (RSI of 70 or higher) during this span (and beyond) has immediately preceded significant corrections in the ETF. Will this time be different? Who knows. Guarantees don’t exist in the stock market but if one incorporates simple probabilities into their trading or investing, it would not be prudent to be looking to buy that “hot solar stock” that got away from you on the next pullback (or breakout).
I may add TAN as a short trade idea with an entry to be triggered on a break below that dashed minor uptrend line (which prices are quickly approaching with today’s huge red candlestick which follows several days of a bearish candlestick formation surrounding Tuesday’s high). However, as usual, my preference is to short the most bearish stocks within the sector and as such, I plan to post a some of the more bearish looking components of TAN asap.