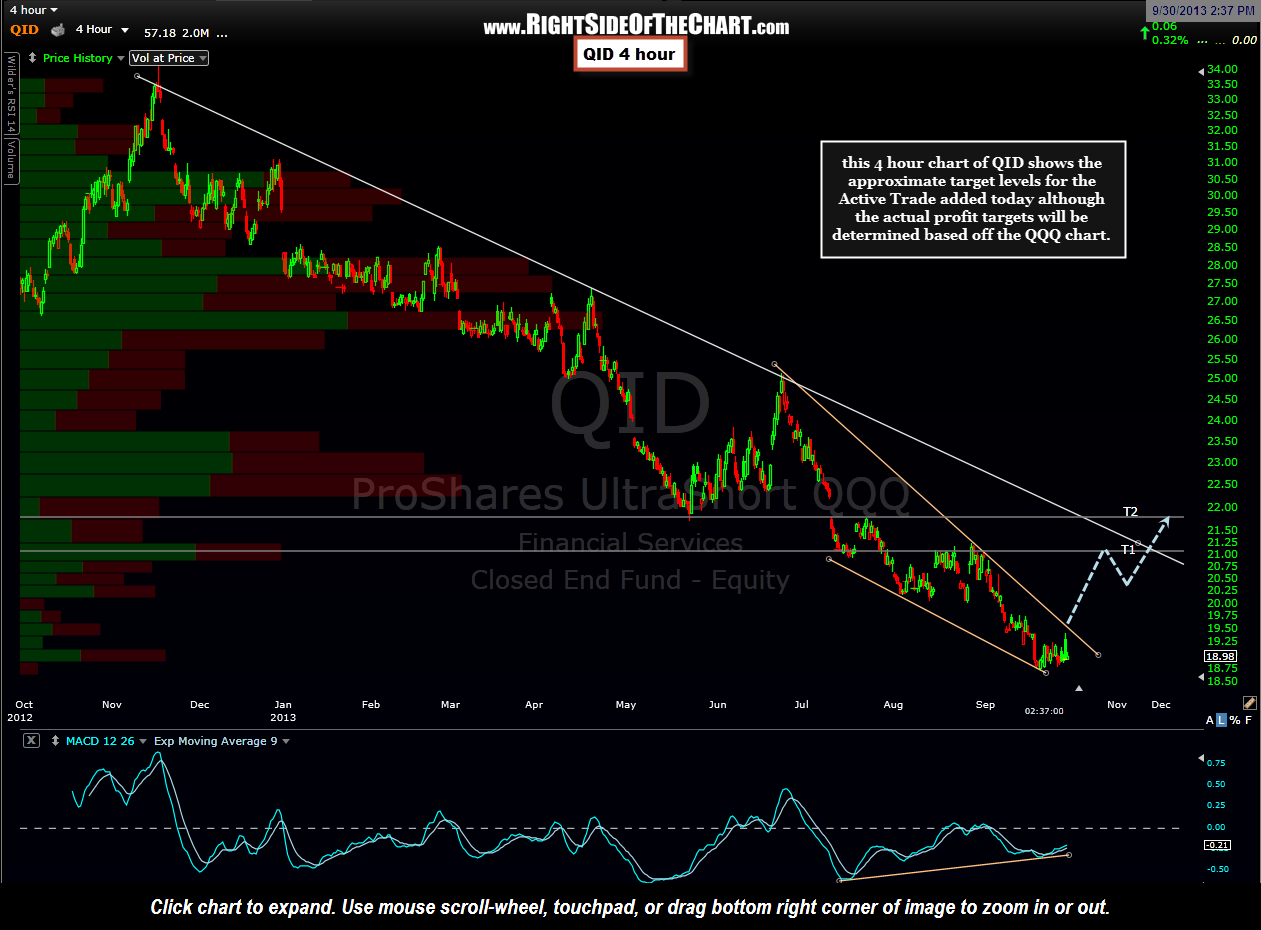
 This 4-hour chart of QID shows the approximate price targets for the Active Trade added earlier today although the actual profits targets will be based off the QQQ chart. Although the price decay is not nearly as bad on QID as some other leveraged ETFs, as with all leveraged ETFs there is some degree of price decay over time and as such, distortion is typically observed on the charts over time with the disparity between the leveraged & the non-leveraged tracking ETF’s, most notably over longer periods of time. For example, this 4-hour period chart of QID is very similar to the previously posted QQQ 4-hour chart although not an exact mirror image. As these chart go back about 1 year, subtle differences in the charts are the result of price decay due to the use of leverage and other variables such as difference in the periodic distributions of these two ETF’s which both track the Nasdaq 1000 Index. As such, the targets on this chart are just a general estimate of where I’d expect significant reactions on QID and will likely take profits (I actually did end up taking some shares of QID in one account today, along with the QQQ puts from the previous post). Just to clarify, QID (along with QQQ) is listed as an Active Short Trade, although technically one would go “long” QID via buying (not shorting) the shares. However, as an inverse (short) ETF, this trade will be categories under the Active Trade- Short category. Exact targets still TBD based upon the next entry which is a breakdown below the QQQ rising wedge pattern.
