
I haven’t posted much analysis on the biotech sector lately as my opinion wasn’t very strong. However, this bearish candle is XBI today is both a breakdown below the bearish rising wedge pattern (white lines) as well as a failure from the recent bullish pennant (blue lines) breakout. My expectation is for a continued move down towards the 73.00 level which would account for about another 7% drop in XBI.
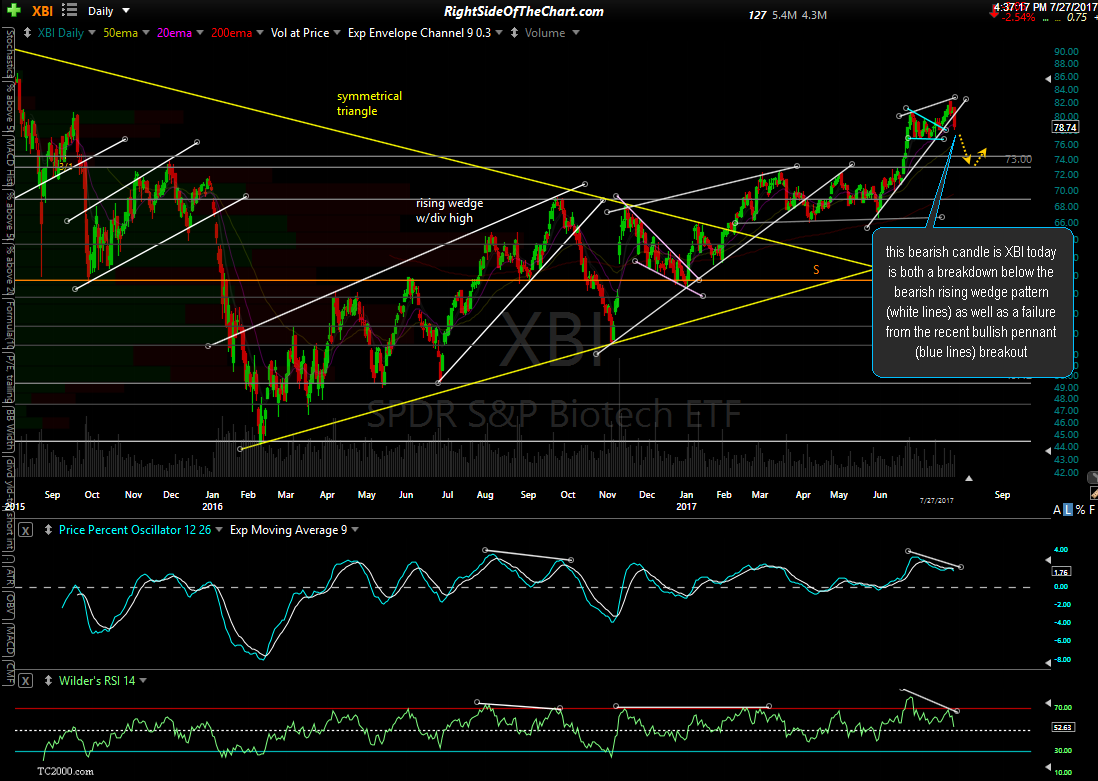
XBI daily July 27th
In this post on Tuesday, I stated that:
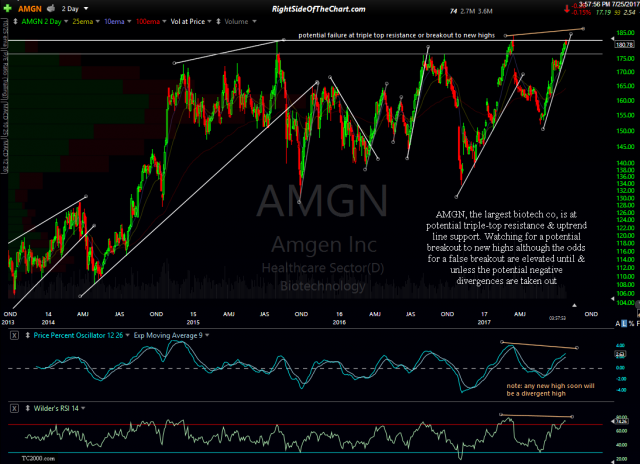
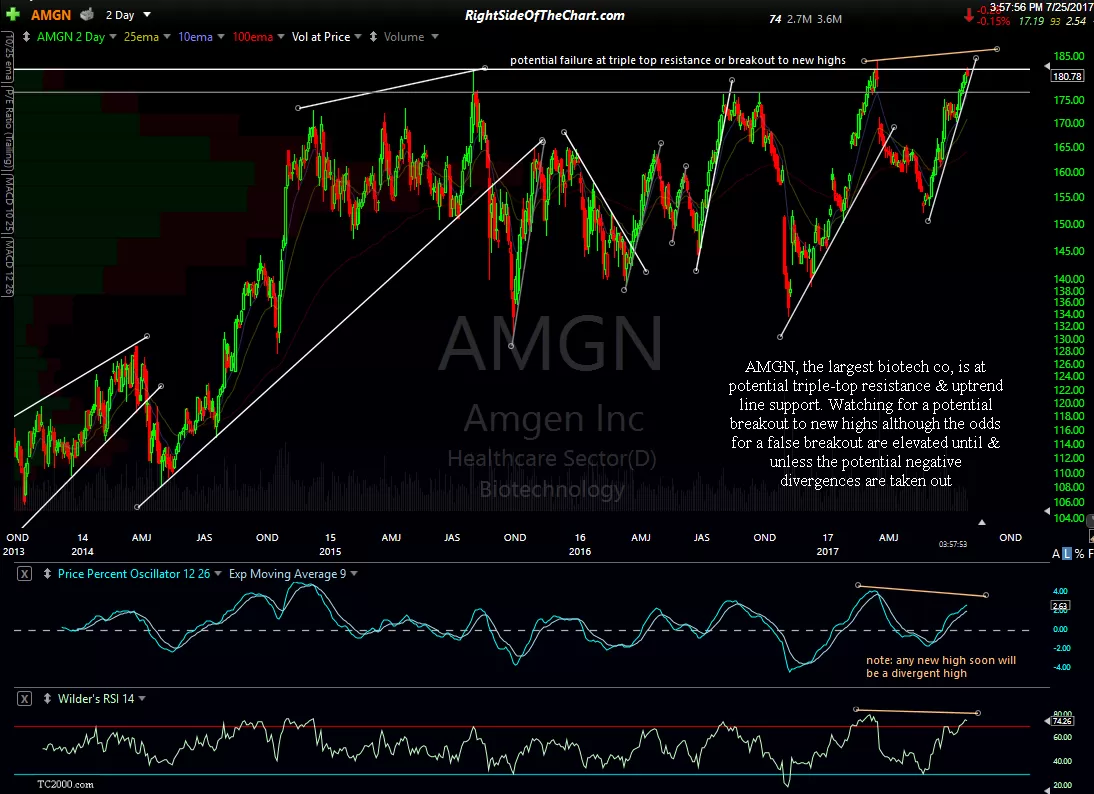
AMGN (Amgen Inc): The largest biotechnology company & top component of most biotech ETFs. How this stock trades following earnings certainly has the potential to affect the biotech sector as a whole. Watching for a potential breakout to new highs although the odds for a false breakout are elevated until & unless the potential negative divergences are taken out.
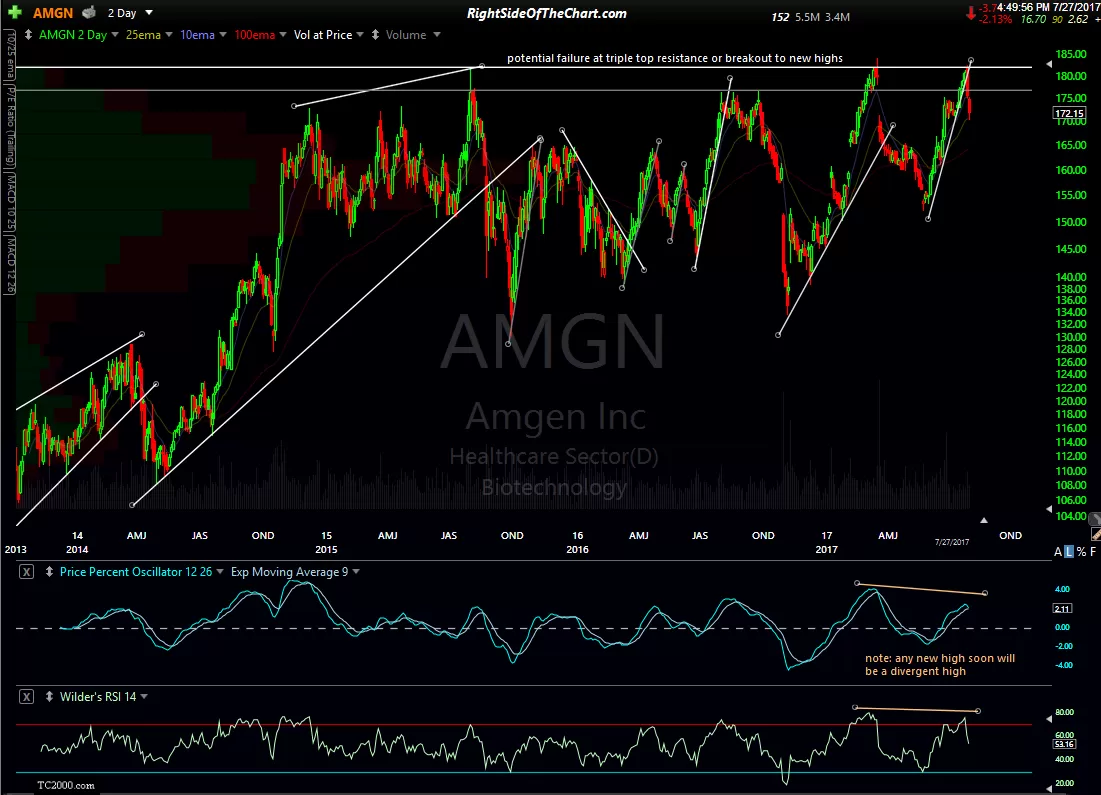
That post was accompanied by the first chart below, highlighting the potential for a failure triple-top resistance as well as noting the most recent steep uptrend line, which was clearly taken out following AMGN’s earnings report & forward guidance. The first two charts are 4-years charts with 2-day period candles & the third is a daily chart showing the recent impulsive selling following the failure at resistance plus the trendline break.
-
- AMGN 2-day July 25th
-

- AMGN 2-day July 27th
-

- AMGN daily July 27th
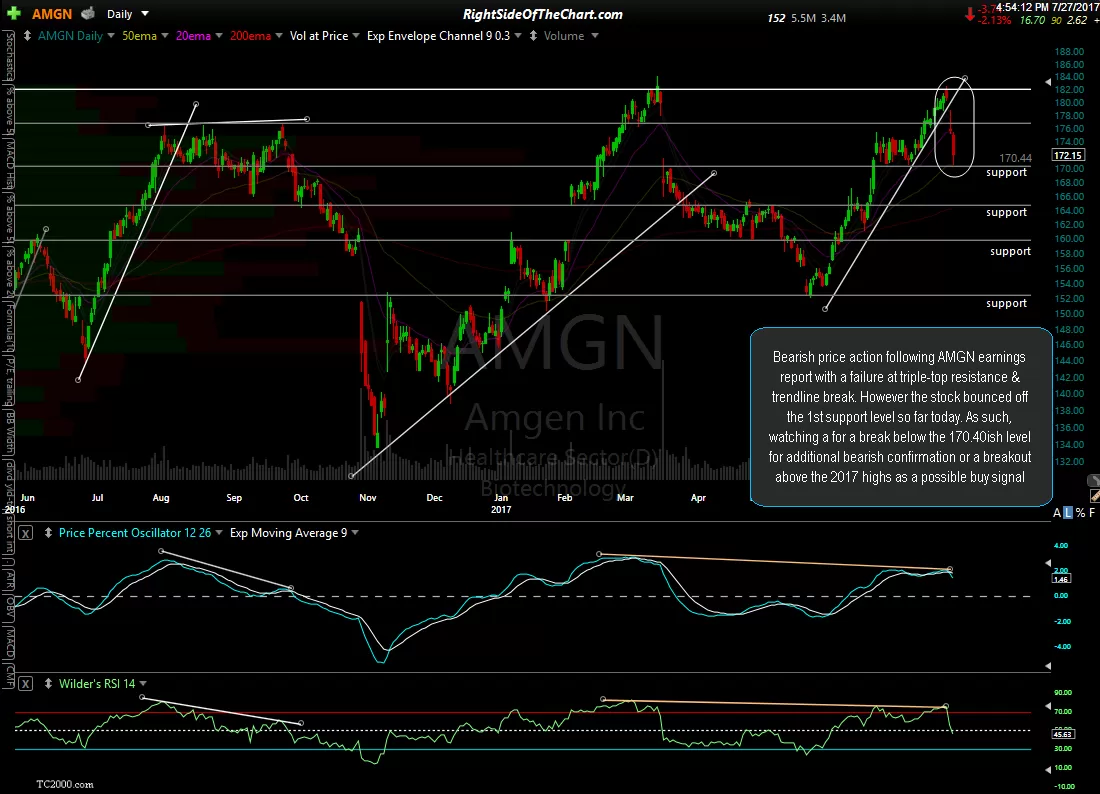
However, I can’t write off Amgen just yet as the stock hit & bounced off the first key support level around 170.44 today. As such, I be watching for a potential impulsive break below the 170.40 level for additional confirmation of the bearish case for AMGN & the biotech sector (as Amgen is the 800 lb. gorilla of the sector) while a convincing breakout above the 2017 highs back in March, assuming there aren’t any negative divergences in place at the time, would have longer-term bullish implications. As of now, I am cautiously bearish on Amgen & the biotech sector.