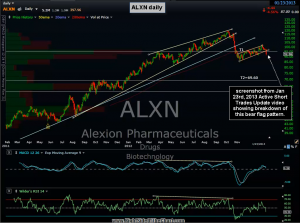
 This first chart is a screenshot of the ALXN daily chart from the January 23rd Active Trades Update video, showing a solid breakdown of a bear flag pattern taking place at the time. ALXN was first mentioned as a short all the way back on October 21st immediately following the breakdown & backtest of that uppermost yellow bearish rising wedge pattern. That entry has since turned out to be the top of the flag pole to this bear flag pattern that subsequently set up as this multi-month swing short trade consolidated in this common continuation pattern that is often needed to alleviate the oversold sold conditions before a stock can continue it’s downtrend.
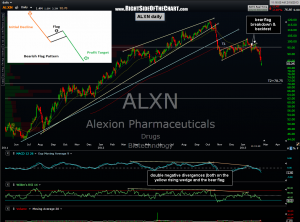
 This updated daily chart shows that since that last update showing the pattern breakdown, ALXN came back to make a successful retest the flag pattern from below where prices once again resumed the primary downtrend and have just recently made a new multi-month low. Now watching for a move below the May 7, 2012 reaction low of 81.28 which would trigger a new 52-week low and likely usher in the next wave of selling, relatively quickly bringing prices to the second and final target. Also note that I have slightly revised T2 (next and final target) on this updated chart to the 70.75 level as this more accurately reflects my new preference of placing the price targets at the optimal exit price vs. the actual level where I expect the stock to bounce or pullback.

