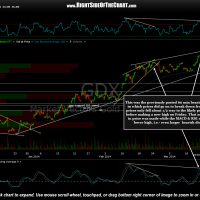
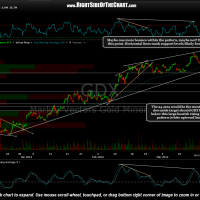
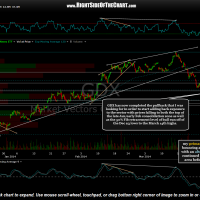
GDX has now completed the pullback that I was expecting, at least enough of it to start adding back a fair amount of exposure to the sector after booking profits in mid-Feb & March. GDX has now hit a key support area defined by the support shelf (series of reaction highs) from late Jan/early Feb as well as the 50% Fibonacci retracement of the powerful run from the Dec 23rd bottom in the sector to the March 14th highs.
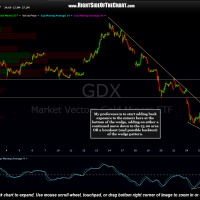
Although my alternative scenario is a continued move lower to the 23.00ish area, which is the bottom of that same late Jan/early Feb consolidation zone as well as the 61.8% Fib retracement of the same initial run off the Dec lows, I’d rather begin adding back exposure now as with both GLD and GDX at decent support levels as well as key retracement levels, the buyers could step in soon. My plan is to add back about a 50% position in the gold stocks (GDX and select individual miners) while continuing to add exposure (i.e.-scaling in) on either a move down to the 23.00 area (my alternative scenario) OR on a breakout (and possible backtest) of this bullish rising wedge pattern shown on the 15 minute chart below. The first charts below are the previous & updated GDX 60 minute charts (showing how the larger bearish rising wedge pattern has played out so far), followed by the 15 minute GDX chart showing what appears to be a bullish falling wedge pattern forming as GDX falls to the aforementioned dual support levels on the 60 minute time frames.
- GDX 60 minute March 17th
- GDX 60 minute March 19th
- GDX 60 minute March 26th
- GDX 15 minute March 26th


