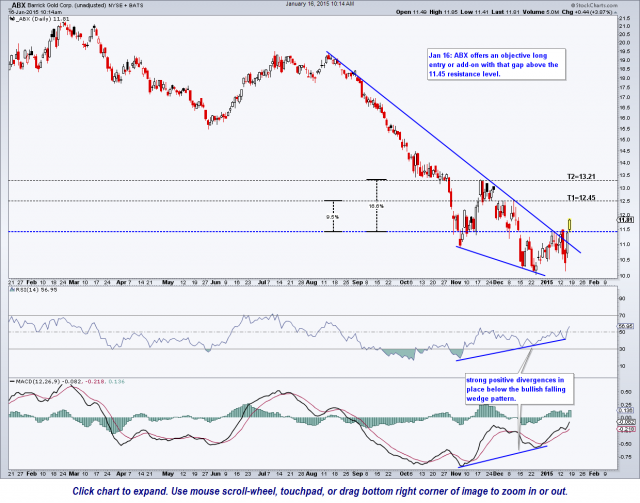
ABX (Barrick Gold Corp) was posted as a Long Trade Setup on Jan 7th with an entry to be triggered on a break above 11.48. Although I usually place price alerts on the trade ideas that I am tracking (and this was/is one of my favorites), I never set a price alert on ABX. On Tuesday, ABX popped just a single tick above 11.48 to print a high of 11.49 that day, thereby technically triggering the entry that was previously stated. The stock immediately reversed, exceeding the suggested stop and so technically, ABX was stopped out for a relatively small loss (3%) the same day the entry was triggered.
I still very much like the pattern despite the whipsaw signal earlier this week. As such ABX will be added as a new Active Long Trade with the same price targets as before. Those who did take the trade on Tuesday and gave it some more room (as I had suggested an unusually tight stop due to my concerns about a pullback in the miners at the time) might consider raising stops at this point.
I’ve spent some time away from my desk over the last couple of day but just wanted to point out that gold ($GOLD/GLD) has clearly and impulsively broken above the Inverse Head & Shoulders pattern that I’ve been highlighting since Dec 12th (see the $GOLD spot gold chart link on the sidebar of the homepage). Keep in mind that $GOLD is an end-of-day chart. Therefore, best to view gold futures or GLD during regular trading hours when trading gold or using it to confirm trades in the mining stocks.


