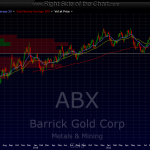
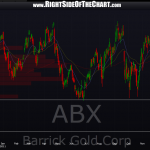
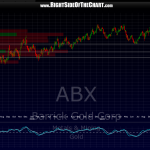
now that i’m back home, i’m working on updating the last batch of gold stock short trade set-ups that i posted back on april 5th. as mentioned that evening, almost all the gold stocks that i looked at had very bearish charts and posted a few of the best looking shorts but that i would update the charts with targets later. the first two charts below are the ABX 2-day and daily charts, followed by the original 2-day chart from april 5th, showing the break of support. sorry for not updating sooner but i just added my targets and the good news is that ABX is trading slightly below T1 (on a likely overshoot) which still offers a slightly better exit.
that brings me to something that i wanted to mention on how i track the results of the trade ideas posted here. i go out of my way to make sure that i do not overstate the gains on the completed trades that successfully hit their target(s). as far as how i calculate gains, keep in mind that there are many variables on potential entry and exit prices on the trade ideas that i post. some trade ideas are posted as set-ups (before they trigger a buy or sell) while i’ll sometimes post a trade idea that i just came across as a active trade.
for trades like the RGR set-up posted yesterday as an active trade (objective short at current levels for an aggressive trader), i will use the price on the chart snap-shot as the entry price. if i find and post an active trade after market hours, like the ABX short trade here, i will use the opening price (assuming there wasn’t a big gap) the following day. as you can see from the 2nd chart below (daily chart) ABX actually opened higher the next day offering a better entry on the short than the closing price on the night i posted it. then it made a re-test of that broken support level a few days later, offering a golden, very objective entry for the trade. however, i will use the opening price as the official entry price, not the re-test.
for trade set-ups, it can also vary based on the type of pattern. for example, the official entry price on a long set-up that triggers on a breakout above a horizontal resistance line would be either the price just above that level OR if the stock gapped up above it but still offered an objective entry, i would use the opening gap price, which would actually reduce the gain to the price target(s). however, many set-ups, like bullish falling wedges, include upward or downward sloping trendlines as the break-point for the trade the entry point on the trade will depend where prices finally cross above or below that sloping trendline.
there are a virtually unlimited numbers of other factors and variables and i do my best to accurately report the gains on the trade ideas posted here. keep in mind that even trying my best not to overstate the returns on these trades, these returns are very unlikely to replicate what any professional traders, myself included, will realize. in the real world, many factors such as commissions, slippage, the occasional order not being filled to to errors, emotions second guessing entries/exits, etc… all come into play which more often than not, have a detrimental impact on performance. yes, those negative factors tend to diminish with experience but some of those can not be completely eliminated from trading or investing.


