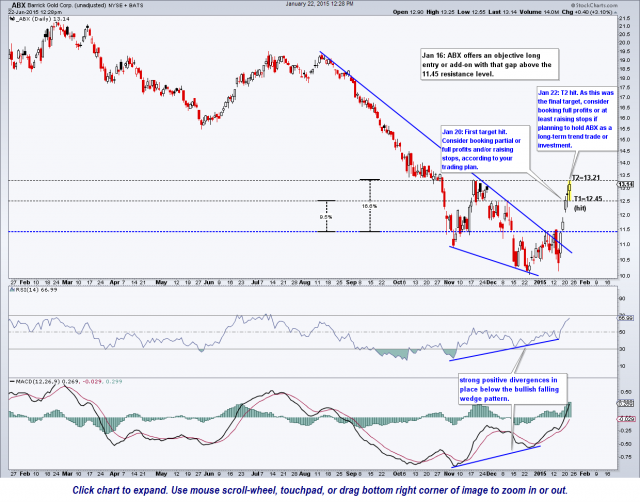
The ABX (Barrick Gold Corp) long trade has hit the second & final target (T2 at 13.21). As this was the final target, consider booking full profits or at least raising stops if planning to hold ABX as a long-term trend trade or investment. click here to view the live, annotated chart of ABX
Regarding the miners in general, GDX is still quite extended while struggling with resistance around the 23.00 area. On Tuesday’s post titled “Pullback in the Miners Likely…”, I stated that I was only “looking for a pullback to around the 22 area”. GDX did indeed pullback yesterday, falling as low as 22.10, close enough for government work although I suspect that we could possibly get one more run down to the 22 area, possibly lower although with the fact that a decent pullback in the miners already occurred (helping to alleviate some of the near-term overbought conditions), I don’t believe that the odds favor another short/pullback trade at this time.
Personally I was holding out for a slightly larger pullback before covering (selling) my GDX short (DUST) and adding back exposure to the sector and with GDX still trading below yesterday’s high, I will continue to hold DUST until we either get one more thrust lower (targeting the 13.75 area on DUST) or I am stopped out (on a move above yesterday’s high of 23.22 in GDX).
Just to reiterate, I remain longer-term bullish on the precious metals & mining sector. Longer-term traders & investors who are also bullish and have been accumulating gold, silver, platinum and/or mining stocks should not be overly concerned with the short-term swing targets and analysis based on intraday charts, other than to possible help time entries/add-ons and in managing/ratcheting up stops.
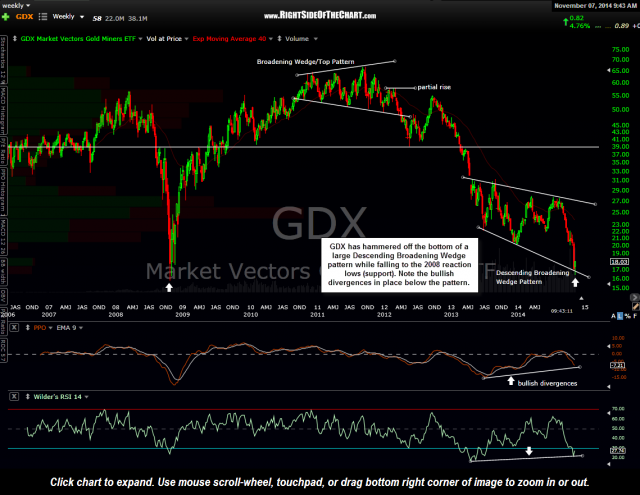
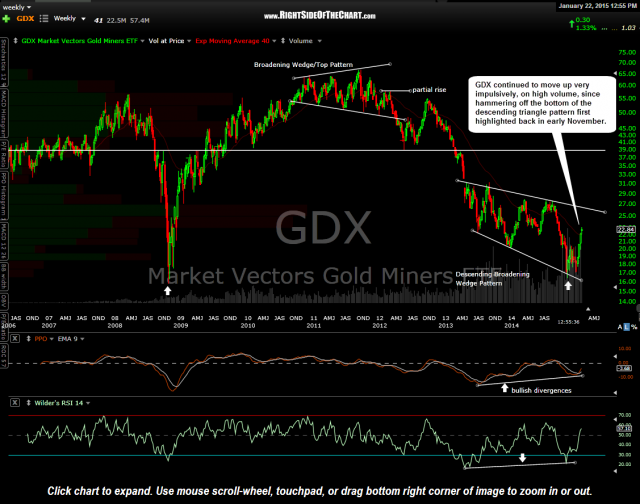
Remember that a very bullish case, both from a technical and fundamental case was made for the mining sector all the way back on November 7th in this post (click here to view). At the time, GDX had just hammered off of the bottom of a descending broadening wedge (DBW) pattern (bullish price action) on the weekly time frame with strong bullish divergences in place. The first chart below was one of two charts from that post highlighting the pattern (the other chart made a bullish case for the miners based on valuation) and the second chart below is the updated weekly chart of GDX. Note the large volume surge leading into the November lows as well as the high volume on the impulsive move higher since. While I would expect some pullbacks along the way, my expectation remains a continued move higher to at least the top of the large DBW pattern.
- GDX weekly Nov 7th
- GDX weekly Jan 22nd


