
Following yesterday’s earnings release after the market close, AAPL gapped down about 7% today. Although I didn’t listen to their conference call or pour thru all the data, I did catch enough to help re-affirm my suspicions that the drop in AAPL, not just since they reported last night but since the all-time high in the stock exactly one quarterly reporting date ago when this Bearish Engulfing Candlestick in AAPL post was published, that the problem with AAPL isn’t so much a deterioration in fundamentals, more so the fact that the stock was just simply over-owned.
Immediately following that April 28th post, Apple’s stock price dropped over 11% which is certainly enough to work off of the bearish divergences that were in place on the daily time frame when the stock printed that bullish engulfing candlestick. However, the negative divergences currently in place on the weekly time frame, comparable to those in place back at the 2012 highs that were followed by a 45% plunge in the stock, still warns of the potential for a much larger drop in AAPL over the coming months.
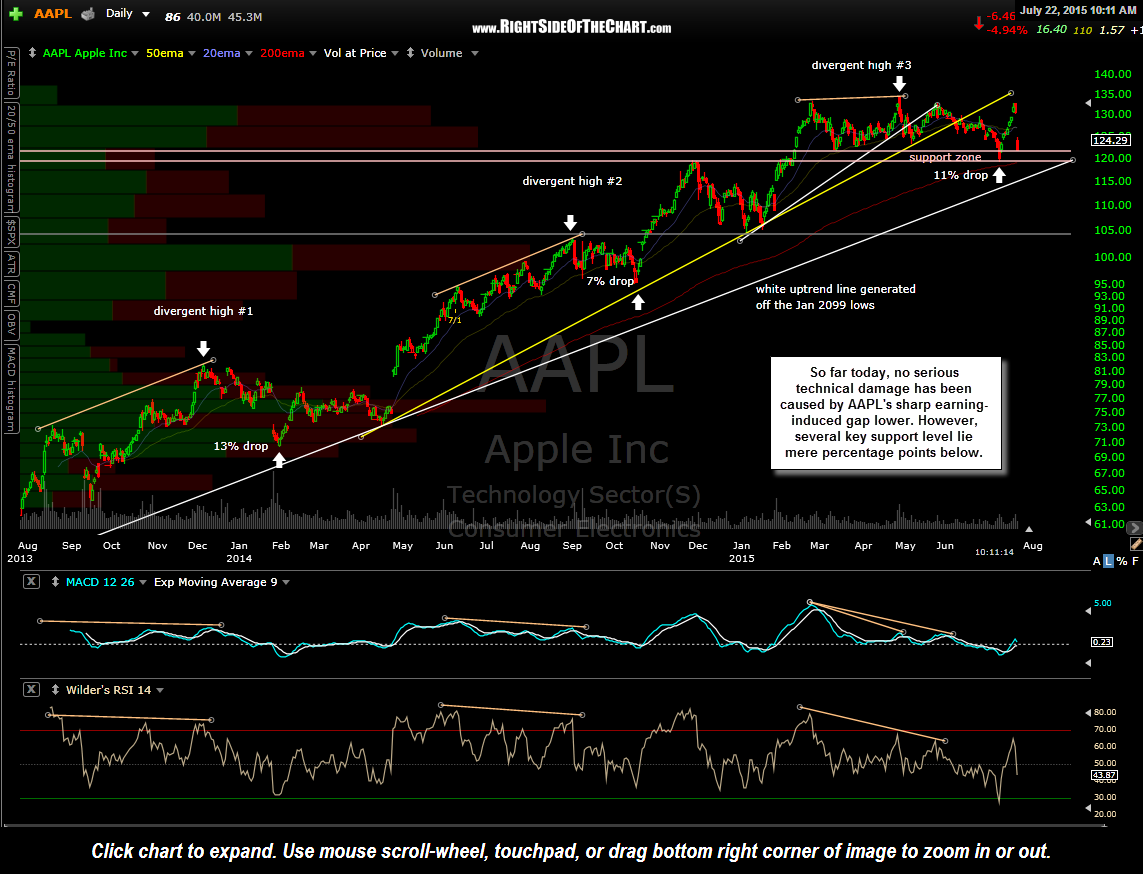
AAPL daily July 22nd
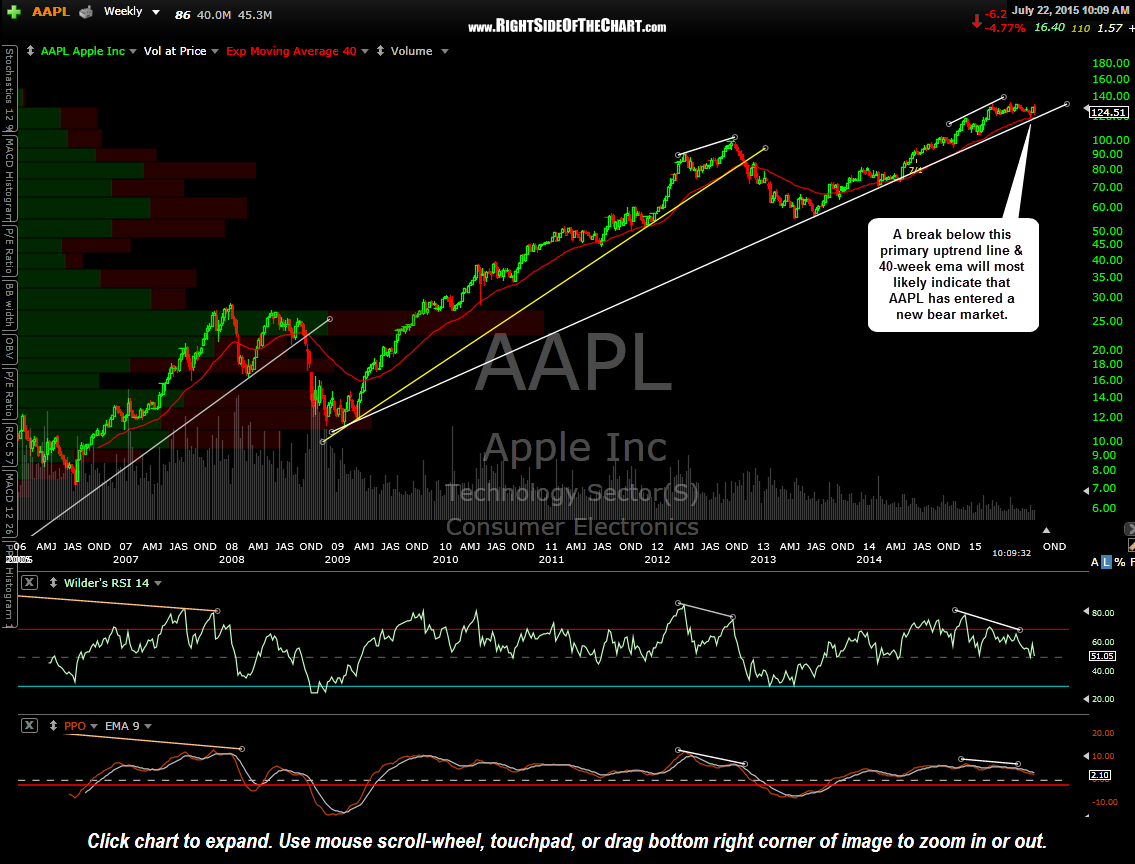
AAPL weekly July 22nd
In the last update on AAPL on July 9th, it was pointed out that AAPL was trading at support which was an objective level to initiate or add to a long position for those bullish on the stock. The stock immediately rallied from there but as back then, I still favor additional downside in the stock in the coming months. However, as previously stated, we need to see AAPL print a solid weekly close (preferably 2 consecutive weekly closes) below the 40-week ema for the next major sell signal in AAPL as the 40-week ema (same as the 200-day ema) has done a good job of defining bull & bear markets in AAPL in recent years.
Bottom line is that today’s price action in AAPL, as ugly as it might seem, has done little, if any, technical damage to the charts. Today’s gap down brought AAPL to the top of the red support zone on this daily chart, with the stock still trading comfortably above the bottom of that support zone as well as the 200-day ema (40-week ema) and the uptrend line generated off of the January 2009 lows (the “last chance” critical support level). As with the broad markets, AAPL is currently sitting in a very precarious technical position but as I like to say, support is support until broken & until then, the primary trend in AAPL remains bullish with the intermediate & short-term trends unclear as AAPL has traded sideways since early February.