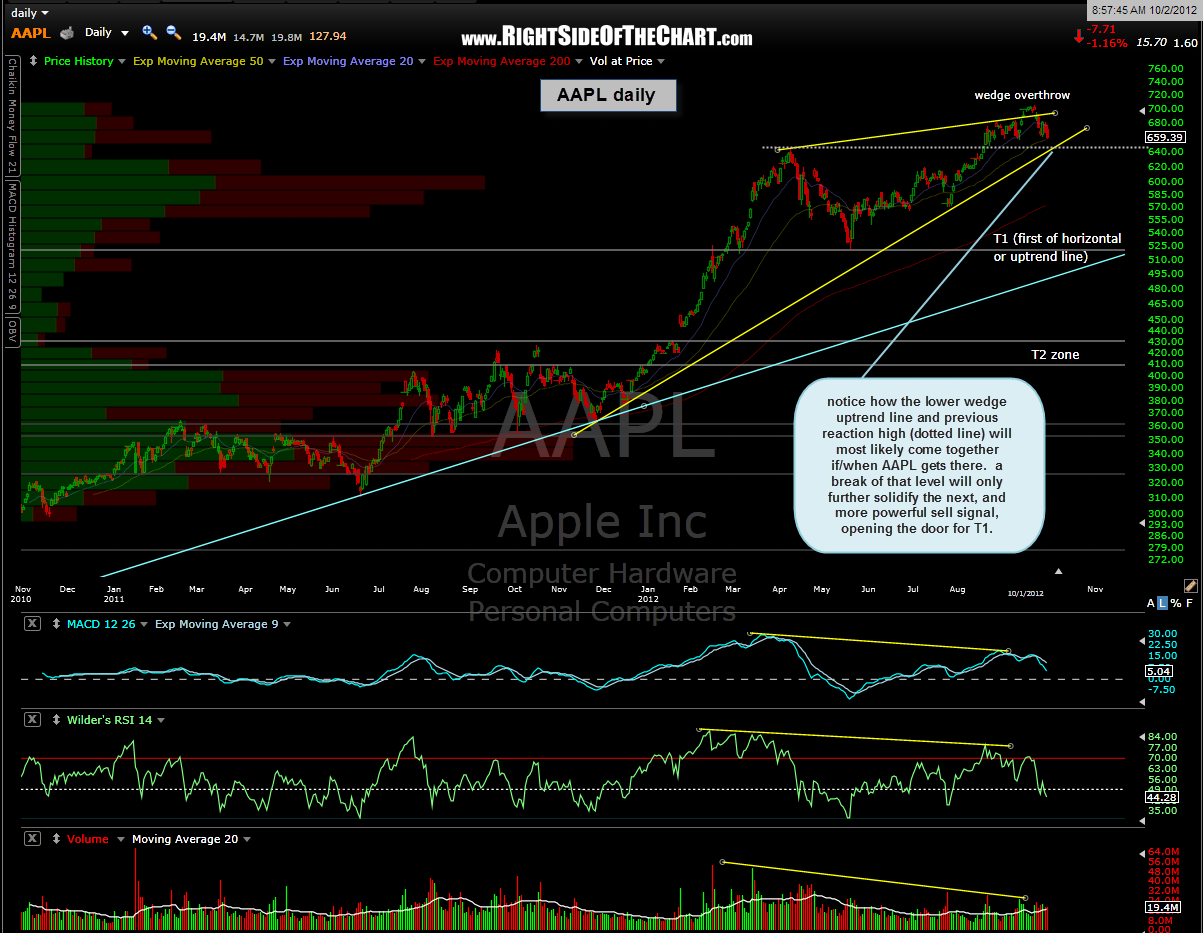
the AAPL short trade is a 20 point gainer as of the close yesterday but that’s only a 3% gain from the entry price of 679.99 on aug 27th. i am still waiting for, and expecting, the next solid sell signal which would be a break below the bearish rising wedge pattern. as noted on this updated chart below, if this trade continues to play out as anticipated, prices should move lower over the next day or so to test both the bottom of the wedge (yellow line) and the recent reaction high made back on april 10th (dotted line). when prices test multiple levels of support (or resistance) at once and break below (or above) those levels, it greatly increases the odds that the breakdown (breakout) the trade will be successful.
remember, support is support until broken so let’s keep a close eye on the Big Dog this week to see how the stock does if/when it tests that level. as covered quite extensively lately, AAPL is the leading stock of the leading index and a solid breakdown of this inherently bearish pattern will almost certainly have a substantial impact on the broad market. also keep in mind that basically all of the bearish patterns pointed out in the $NDX top 10 holdings videos also continue to play out as well (the top 10 components in the $NDX have a larger weighting than the remaining 90 stocks in the index). AAPL daily charts in order as posted with the updated chart last.