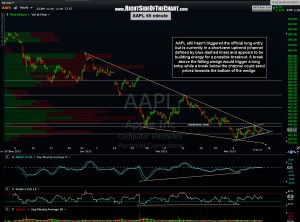
 I continue to watch the AAPL long setup closely for a breakout above the bullish falling wedge. Here’s an updated 60 minute chart showing a small ascending channel that has set up within the wedge pattern. My current thoughts on AAPL are this: First off, if you are a long-side only trader or longer-term investor, I think AAPL has offers one of the best R/R opportunities on the long-side right now. By that I mean that I believe the upside potential from current levels outweighs the downside risk by a fair margin. However, I also believe there is a chance that even if this setups triggers an entry (a break above the 4-hour or 60 minute bullish falling wedge pattern), that the breakout may get sold into just as it starts to look good… a lot like what I expected with the gold stocks and so far, seemed to have happened yesterday while I was traveling.
My concerns with AAPL has a lot to do with my concerns for the broad market. Chasing long side breakouts at this point, with the market so over-extended and numerous red flags, means that the odds for a fake-out (false breakout) is increased, at least until we get some kind of half-decent pullback in the market. However, an half-decent pullback would also increase the odds that my bigger-picture SPX rising wedge overthrown scenario might play out. Therefore, the bottom line is that if you take AAPL (or any other long trade idea at this point), consider keeping your position size on the light side for now as you can always add to the position if it just continues to climb or if we do finally get that long overdue pullback. Of course, regardless how small you adjust you position size, do not become complacent with your stops. Along with the updated 60 minute chart I have included my weekly chart on AAPL. This chart shows the price targets that I’ve had on AAPL for many months now and although we have now finally hit my first weekly downside target (432) and I do favor a tradable bounce off this level, I still think the odds are good that AAPL may see at least T2 (365) some time later this year. Maybe we get that bounce I’m looking for first (which could prove to be a lucrative, multi-month swing trade), maybe not.
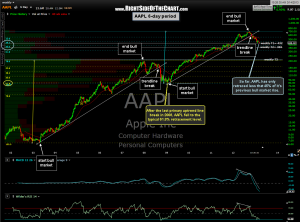
 Trade the charts and don’t be married to any one bias of what AAPL will or will not do. From a pure technical perspective, as this 6-day period chart clearly illustrates, AAPL has only relatively recently broken down from this most recent primary uptrend line which has defined the previous bull market in AAPL that began in late 2008 and ended in Sept 2012. So far, AAPL has retraced just under 45% of it’s previous bull market gains (and as AAPL has fallen about 40% off that peak, it is well beyond the typical 20% drop definition for a bear market). Using fibonacci retracements, it is common to see a stock or index to retrace anywhere from 38.2% to 61.8% of the previous trend. As shown on this 6-day period chart (a weekly chart is a 5-day period), following the previous bull market in AAPL (April 2003- Jan 2008), the stock fell to around the 61.8% retracement before ending it’s bear market in late ’08/early ’09. Therefore, although AAPL is already well with the “typical” retracement range, there is still plenty of downside left in that range, should the support level that the stock is current holding above give way and another wave of selling kicks in.

