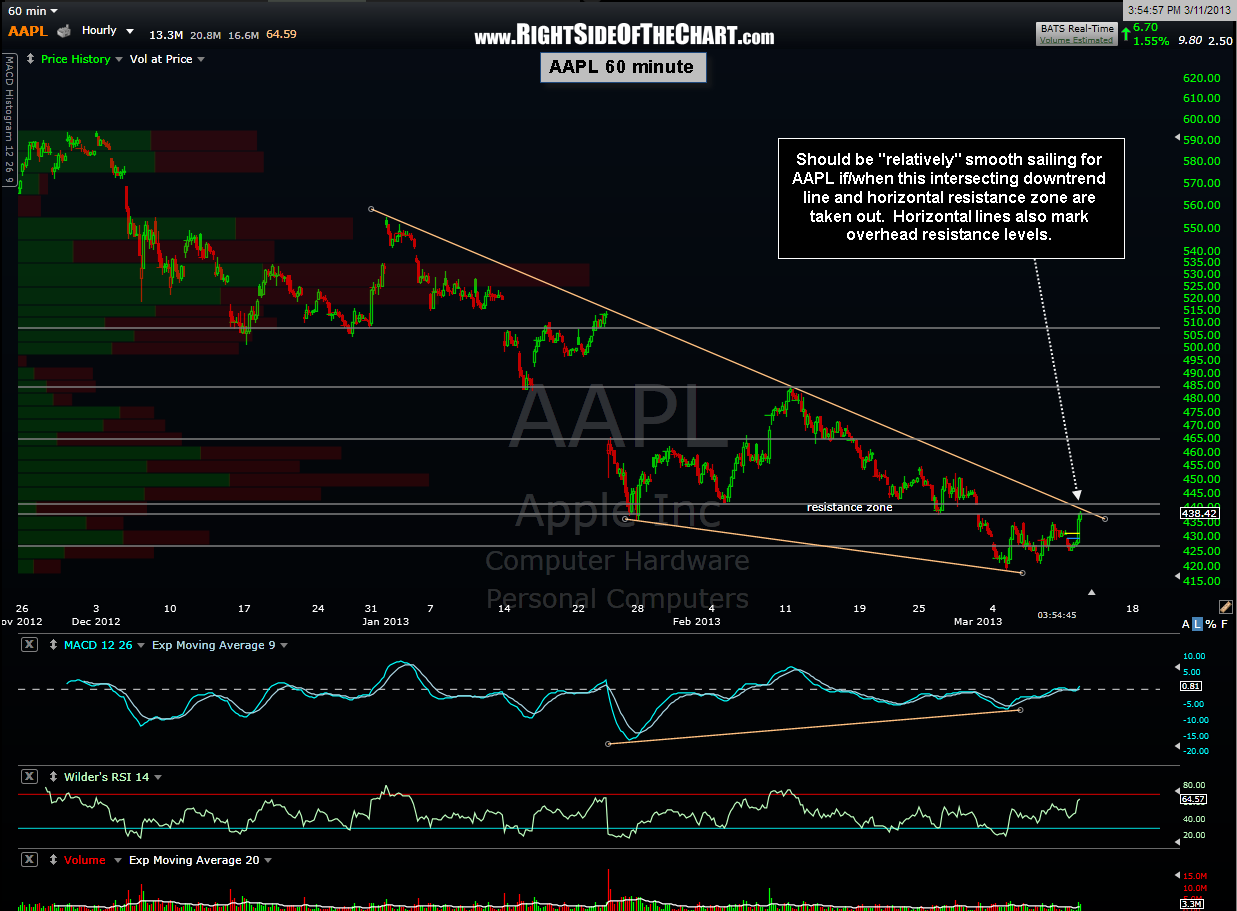
 Zooming in on the AAPL trade/setup even further, here’s a 60 minute chart which shows that key downtrend line that I’m watching for an additional/confirmed buy signal. As you can see from this chart, that downtrend line currently intersects a nice resistance zone (as defined by the March 1st gap as well as several recent reaction levels in the stock). Therefore, any solid break over that level would likely bring in a new wave of buyers. I have also added a few overhead resistance levels to keep an eye on.
