AAPL (Apple Inc) is currently trading well below the symmetrical triangle. First downside target would be the 200ema/515.60 area. click here to view the live daily chart of AAPL
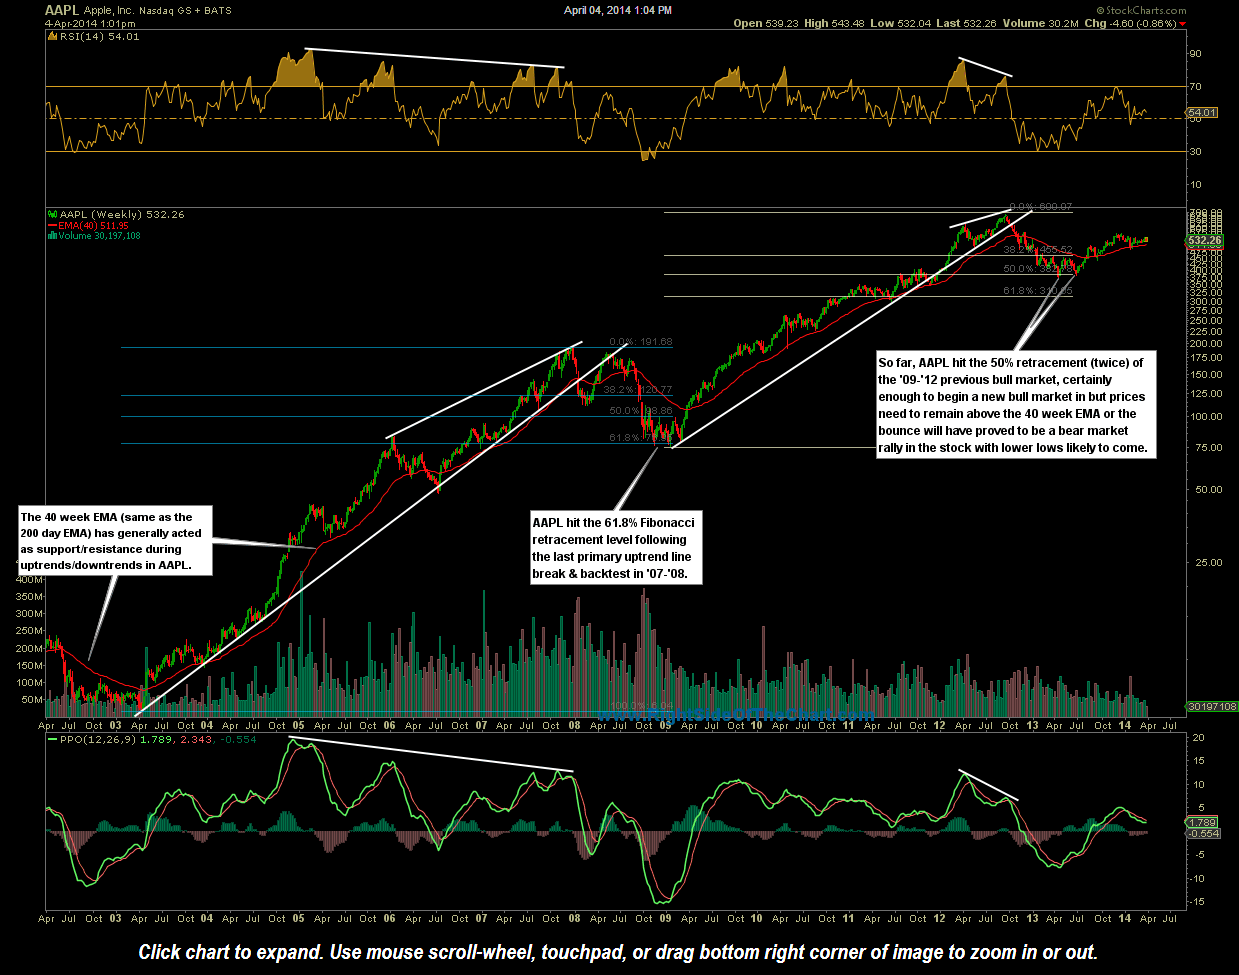
Also keep in mind that the 200-day EMA, which is the same as the 40-week EMA, has done an excellent job of defining major bull & bear trends in APPL in recent years as evidenced on this 10-year weekly chart. click here to view the live weekly chart of AAPL


