
AAPL (Apple Inc) is now at the “sweet spot” of this bearish rising wedge pattern where breakdowns typically occur. A break below the wedge would likely bring prices to any or all of these potential target/support levels. Negative divergences confirm the bearish nature of the wedge & warn of a likely impending trend change. 60-minute chart:
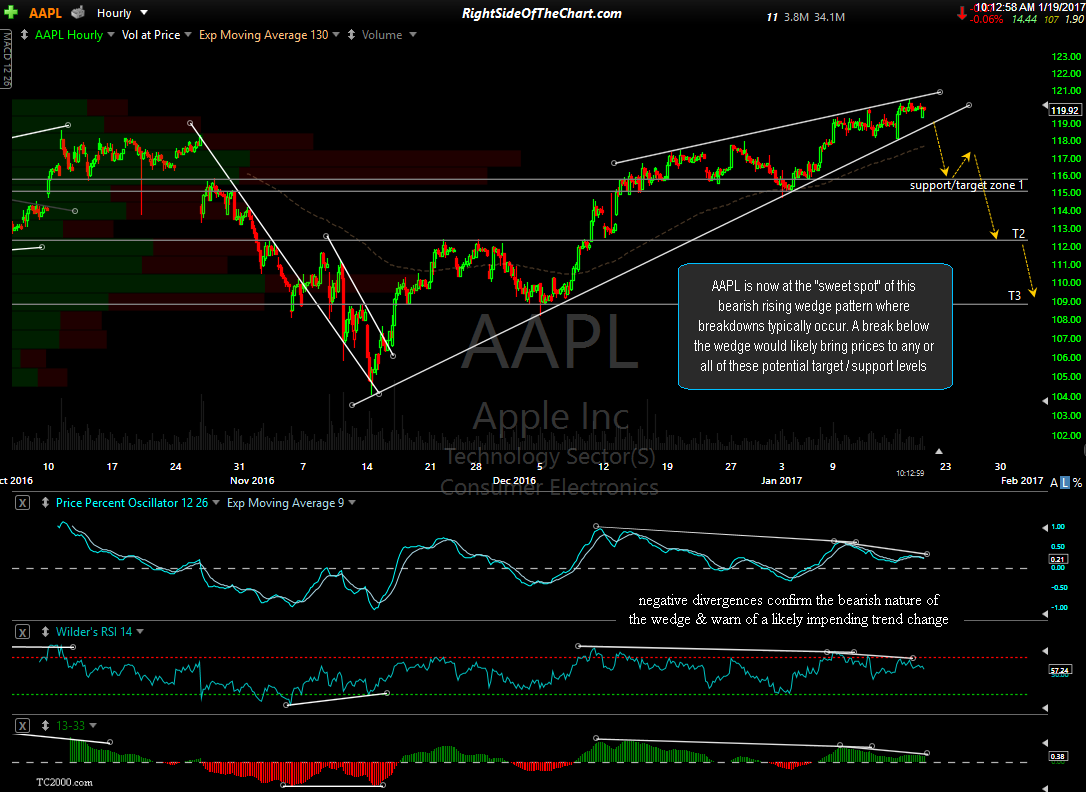
AAPL 60-minute Jan 19th
This is an unofficial trade setup for now although under consideration as an official trade idea but I’d like to see a little more evidence supporting a pullback in the broad markets before adding this largest component of both the Nasdaq 100 & the S&P 500 before adding Apple as an official trade.