
There are a few technical developments that I’ve been monitoring on AAPL that could spell trouble for the worlds largest company and largest component of both the S&P 500 and Nasdaq 100 Indices. When I added AAPL to the new live chart links page a few weeks ago, I pointed out how the stock was approaching the 50% Fibonacci retracement level of the move down from it’s all time high of 705.07 set back on Sept 21, 2012 to the low of 385.10 on April 19, 2013. It was also pointed out that negative divergences on both the MACD & RSI were building as the prices were moving higher. Those divergences have continued to build and with the RSI now clearly turning down from overbought readings (another historically reliable sell signal that was pointed out) and the MACD starting to turn down (although still pending a bearish cross-over in order to confirm the divergences) there is a substantial amount of bearish technical evidence now in place that indicates the odds for a trend reversal in AAPL are elevated at this time.
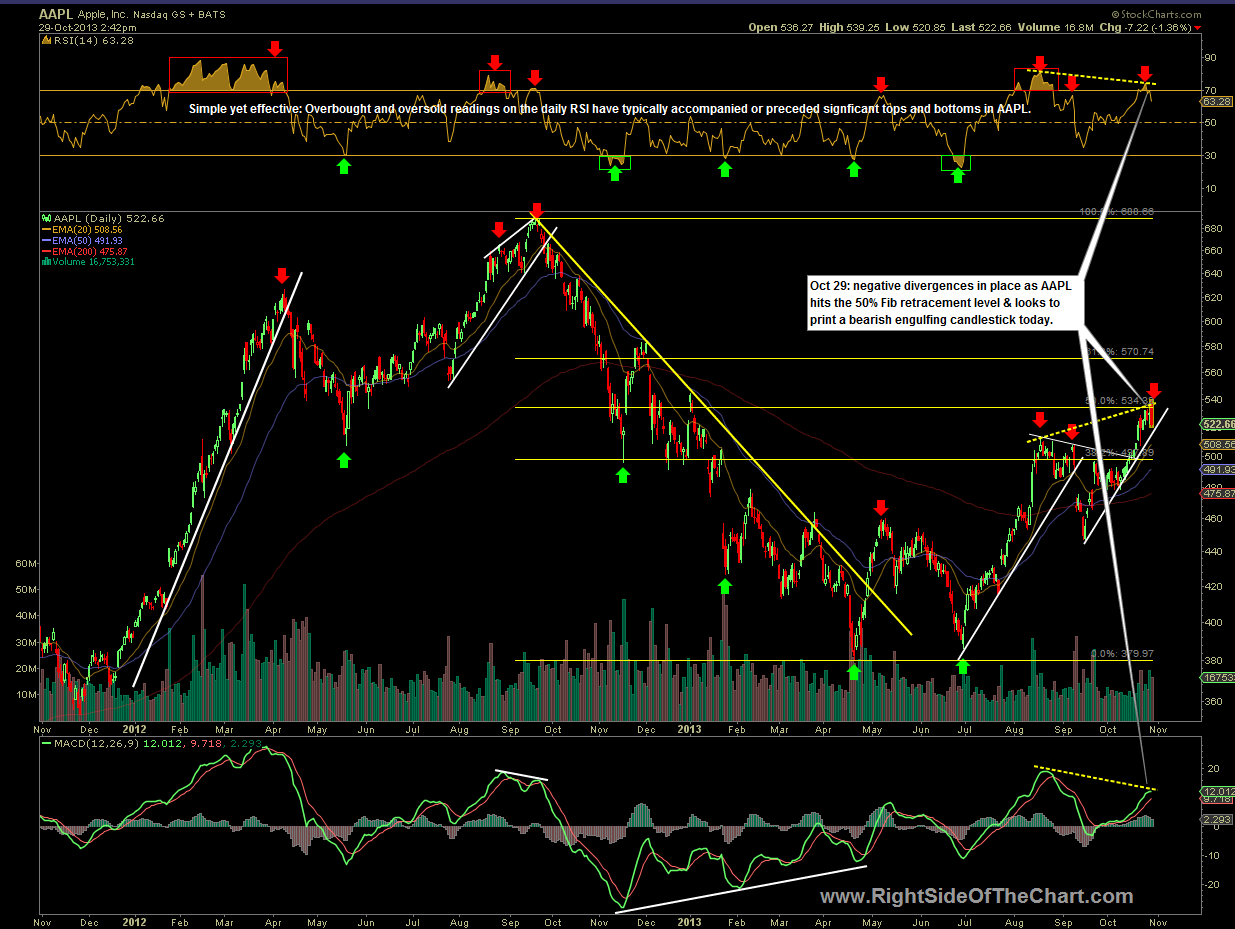
I’ve updated the live chart which can be viewed by clicking here (static version shown above) to add an uptrend line generated off the Sept 17th lows which, if broken, would further increase the odds that a new downtrend has begun in the stock. As I type, with slightly less than one hour left in the trading session, AAPL is currently poised to print a bearish engulfing candlestick which would maul the previous 3 candlesticks, a clearly bearish technical event. With the current bid beneath the broad market still strong, I’m not going to add AAPL as a Active Short Trade at this time (just a Trade Setup) although an aggressive trader or someone looking to hedge a portfolio of longs could certainly establish a starter position assuming that AAPL doesn’t rally into the close and manage to avoid printing the bearish engulfing candlestick. Again, further evidence to support a likely trend reversal will come on a break below the current uptrend line as well as a bearish crossover on the MACD.
note: A few new charts have been added to the Live Chart Links page, including Light Crude Oil – Spot Price (EOD) ($WTIC).