
I was asked my opinion on AAL (American Airlines Group) earlier today & figured that the chart was worth sharing. After breaking down from a Rounding Top pattern, AAL is close to backtesting the former support, now resistance level from below. A solid break above would be bullish, providing a long entry, while an objective short entry would come on either a backtest of the 45.75-46.00 resistance OR a solid break below the current rounding bottom (yellow curved trendline). AAL is an “unofficial” trade idea meaning that it will not be added as an Active Trade (long or short) if either of the entry criteria stated above are met. I am simply pointing out this potential trading opportunity as there are some fairly significant technical developments & well-defined levels on this chart.
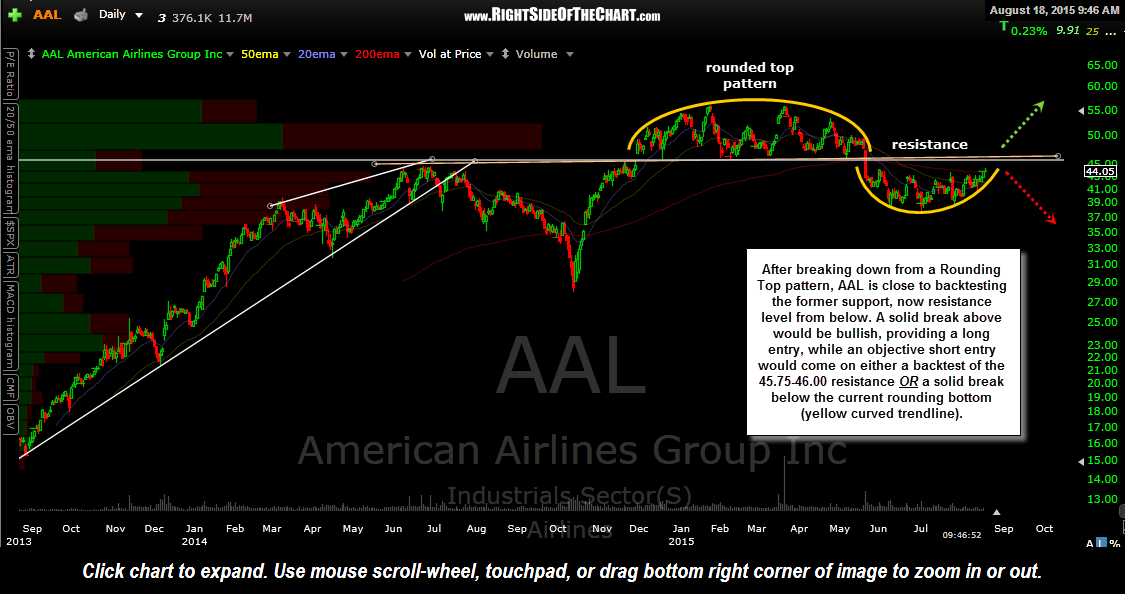
AAL daily Aug 18th
For those that have followed RSOTC for a while, you might have noticed an unusually large proportion of unofficial trade ideas lately, which is a direct reflection of the current market conditions. Unofficial trade ideas are those in which I don’t have the usual degree of confidence but still might be worth passing along for those interested. Unofficially trades usually don’t included explicit price targets/suggested stop parameters & typically are not followed up on whereas all official trade ideas are ultimately moved to the Completed Trades category to be archived indefinitely, whether successful or not.
For the bulk of 2015, this market has resembled an irregular/erratic EKG: moving sideways while chopping around in a difficult to trade, nearly impossible to predict trading range. For swing traders, that means a marked increase in the number of false buy & sell triggers, i.e.- whipsaw signals that result in trades either falling short of their expected profit target, stopped out, or becoming “dead money” as the stock or ETF trades range-bound for weeks or even months on end. Trend traders & investors have likely found this market equally frustrating as there simply isn’t a trend to trade with the US equity market essentially flat YTD as we’re already half way through the third quarter of 2015.

$SPX daily Aug 18th
In hindsight, the last 6-8 months would have probably been a good time to use some of the option spread strategies designed to profit from a sideways market but then again, I doubt that anyone could have foreseen just how long the market would trade in such a tight range. As mentioned recently, the monthly Bollinger Bands on the Wilshire 5000 have contracted to levels not seen in decades, if ever. The good news for those who are waiting patiently for the next tradable run in the market, is that sharp, relatively uni-directional moves often follow such contractions in the Bollinger Bands and the scope of the move is often relative to the duration & level of contraction or “pinch” in the Bollinger Bands. Hang in there as historically, August thru October have traditionally been marked by sharp moves in the markets.