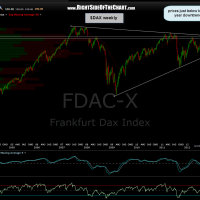
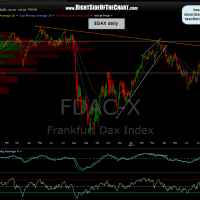
The first chart below is the German Dax daily frame, showing a clear breakout of both the primary downtrend line off the 2011 highs as well as prices recently taking out the previous reaction high from 3/16/12. From a technical perspective, that price action is unarguable bullish. However, keep in mind that when looking at the charts from a longer-term perspective, as you can see from the next chart (weekly DAX), prices are just below an even bigger multi-year primary downtrend that dates back to the mid 2007 peak in the DAX. Just because prices on a chart are approaching a key resistance level in itself is not bearish, as resistance levels can and often are taken out. However, common sense (and TA 101) would dictate that going or remaining long as prices approaching key resistance very often proves to be unwise as prices may pullback sharply off that level. Resistance is resistance until broken, and then it becomes support. Bottom line on the DAX: Normally I would say short-term bullish due to the take on the daily chart but with prices approaching an even more significant (longer-term) downtrend line WHILE approaching overbought readings (weekly RSI over 67), I would urge extreme caution in trading the DAX or any of it’s components.
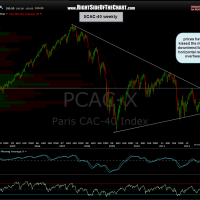
Next two charts are the Paris CAC-40 daily & weekly charts. Virtually identical notes as the DAX so I won’t expand much. Recent bullish key downtrend line breakout and successful retest on the daily time frame, which undoubtedly has sucked in tons of new buyers and sparked a lot of short covering. However, like the DAX, prices are challenging a more significant, longer-term downtrend line on the weekly chart so anyone going long here is investing contrary to TA 101 (buy support, sell resistance). Again, resistance, once taken out, is bullish so if these longer-term downtrend lines are convincingly taken out, then the longer-term picture will be increasingly bullish. Until then, resistance is resistance.
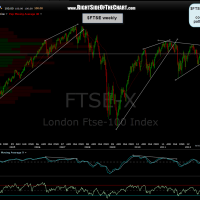
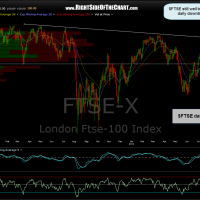
Last two charts are the London FTSE. As you can see on the daily chart, prices are still well below the primary daily downtrend line and well within a triangle pattern on the weekly chart. Therefore, the $FTSE is in what I like to refer to as “no man’s land” from a technical perspective (neutral).


