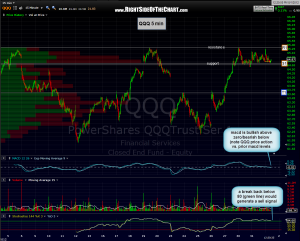
 5 minute chart of the QQQ showing near-term support and resistance levels. the stochastics have remained above the 80 level going on 4 days now which increases the chance of a pullback soon. a break below this support zone on the QQQ would likely be confirmed by the macd crossing below the zero line and the stochastics below the 80 level and most likely bring prices rather quickly to the first target marked (63.65 level).
Note: i have added a new sub-category to the Market Analysis parent category labeled “Intraday Market Analysis”. this category is geared towards the more active trader and will focus on shorter term chart patterns such as the 1 minute thru hourly charts. if you are a longer-term swing trader or investor and do not wish to receive email notifications of these posts, you can deselect that category in your settings page by clicking on the change settings/unsubscribe link at the bottom of any of your email post notifications.

