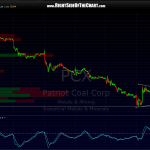
 fyi- i moved my stop up to just below this line, which is actually a few cents below entry. however, that looks like an objective technical level that PCX need to holds on any pullback or risk another wave of selling. an upside break of this triangle would likely cause the stock to make another thrust higher. remember, this stock has been in complete free fall mode and could be trying to pound out a bottom here. therefore, each spike up on volume is often met with a follow-up wave of remorseful longs using that pop as an opportunity to end the pain and sell their position. as always, the million dollar question is; are there more trapped longs waiting to sell on an bounce or have the sellers exhausted yet? unfortunately, volume patterns on the daily chart show no indication of a selling climax. however, the recent surge in volume on the intraday charts could signal the early stages of at least a near-term selling climax. 5 min chart shown.

