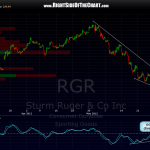
 here’s the RGR 60 minute chart with the bullish falling wedge mentioned in the post below. please read that post below if you are in the RGR short trade as i revised the final target to current levels vs. the previous final target of 32.92. i am now watching this pattern for a possible long-side entry on a upside break of the pattern. aggressive traders could take a shot here at the bottom of the wedge with the appropriate stops in place but i must caution that the near-term technical picture is a bit unclear at the moment. more nimble traders might have success trading off the intraday charts here but the less experienced or those that prefer longer-term swing trading might want to keep things light for now.

