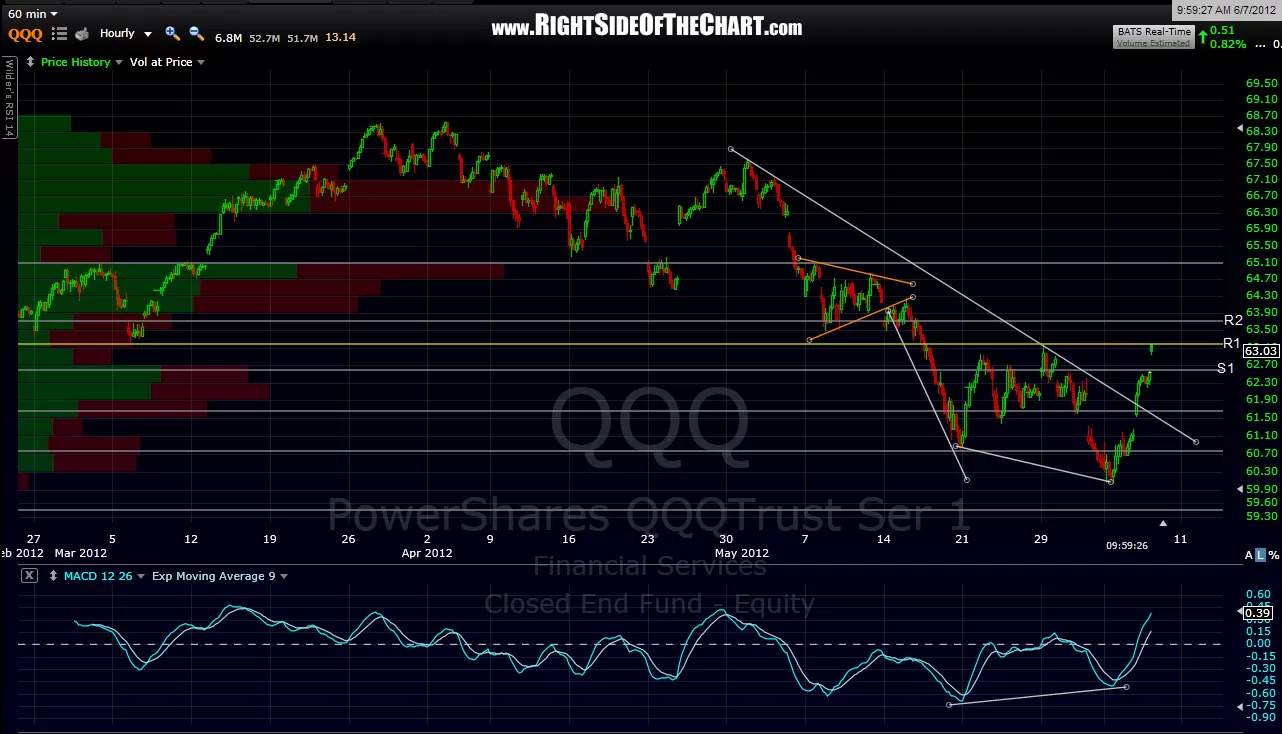
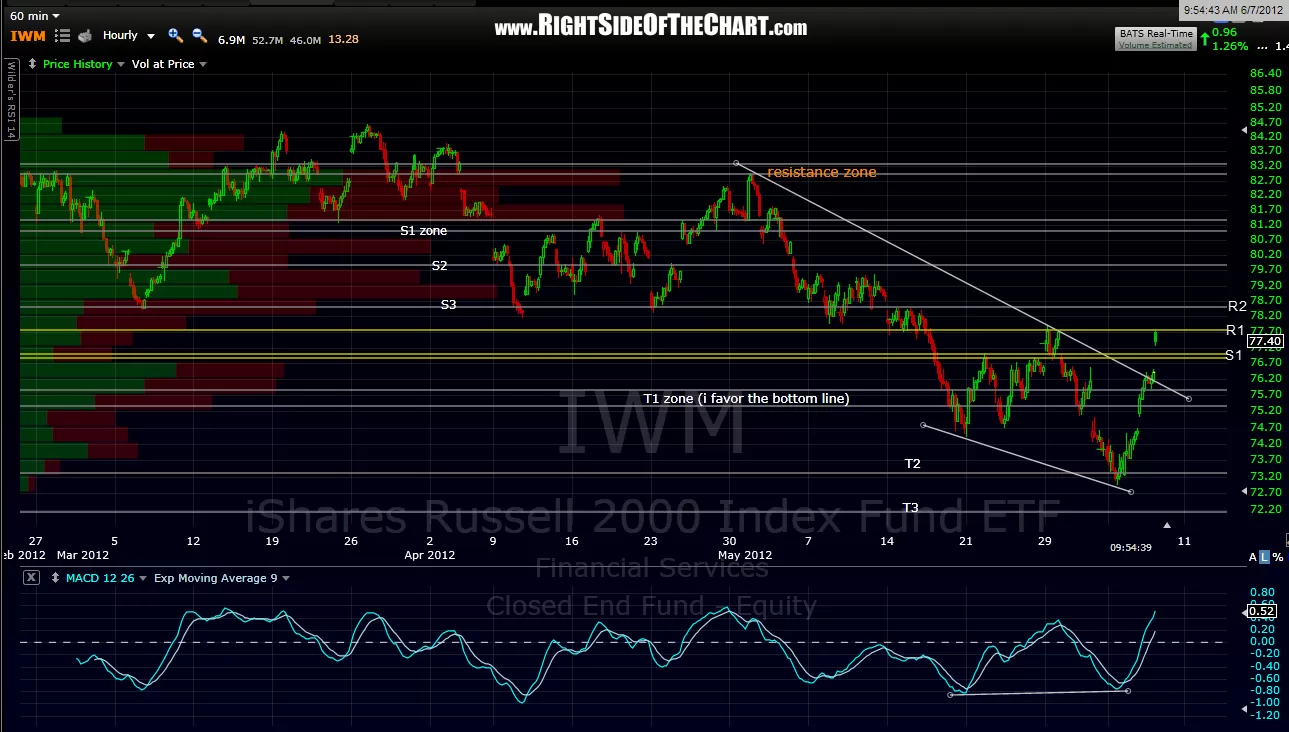
yellow horizontal lines have been added to these charts which show potential support and resistance lines. white horizontal lines were previous supports on the way down, which should now act as resistance on the way up. i would put the odds at pretty good that the market pulls back from at or near current levels with the major indexes short-term overbought at resistance. my target for a pullback is S1. QQQ & IWM 60 min charts below, SPY 60 min in previous post.

Results for {phrase} ({results_count} of {results_count_total})
Displaying {results_count} results of {results_count_total}