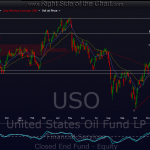
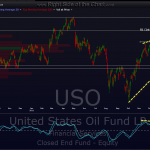
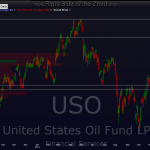
here’s a string of recent USO (crude oil etf) daily charts in order as posted (today’s chart last) for a visual reference of how USO was a nice short from the highs, back when the masses were screamingly bullish on crude oil prices (although i personally didn’t ride it all the way down). as you can see, USO has finally hit the bottom of that support zone that i discussed in the may 7th trade ideas video and has actually found support there for the last 3 days.
looking at the 60 minute chart (not shown here) i can see some pretty nice positive divergences in play that could lead to a nice oversold pop off current levels. therefore, although i’m not going to add this as a trade idea at this time, aggressive traders could take a shot at a USO long (or related derivative such as DCO, UCO, crude futures, etc..) here with a stop on a move below the recent lows and a price target of 36.00 (i’d place my sell limit just a few pennies below the target to help assure a fill), which gives this trade about a 6:1 R/R ratio based on today’s closing price (and USO can still be bought as i type in the AH session around today’s closing price).


