This post is sort of a follow-up to my last post regarding sentiment extremes made back on April 27th, literally just two trading sessions before the market made a nearly vertical drop of roughly 9% from it’s May 1st peak (click here to view that post). The catalyst that prompted me to make that post was the buzz that I was hearing from the trading community about how bullish the sentiment readings at that time were as we had just recently had 4 days of sharp selling and the bull/bear ratio had spiked to very bearish readings. Please read the previous post first for a better explanation of why these sentiment surveys act as contrarian indicators.
The point that I was trying to impress in that previous post as well as the chart below is the lag time involved from when these extreme readings occur until the effects of lopsided sentiment often play out in the form of market tops or bottoms. In that previous post, I highlighted how the bullish sentiment had actually peaked about 4 months before the May 2, 2011 market top and how we had a similar cluster of bullish extreme readings in early January & February of this year, approximately the same amount of time before the market recently peaked.
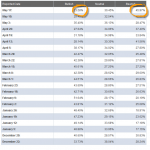
What the chart below highlights is that this lag time often works both ways; several months before tops, as discussed above as well as several months before market bottoms. If one were to click on the “Sentiment Survey” link under the ‘Tools of the Trade’ box to the right of this page, what would likely stand out are the results that I circled in orange below (1st chart). These readings are the most bearish extremes (highest percentage of bears PLUS lowest percentage of bulls) since that massive sell-off in Q3 2011. In fact, if you look at the longer-term readings that I overlaid on the SPX chart, you will see these recent extreme bearish readings are nearly identical to the readings from 6/9/11 (both highlighted in orange). Also note that the 6/9/11 readings were the first extreme bearish reading of that magnitude since the market began a very nasty correction after topping on May 2, 2011. I’m sure many bulls jumped all over those readings as a reason to get long(er) yet as that chart clearly shows, those extreme sentiment readings (again folks, nearly identical to the latest weekly readings) came, you guessed it, almost exactly four months before the market bottomed on October 4, 2011. I’m also willing to be that if you read enough trading articles, blogs, newsletters and market comment that you will find plenty of pundits citing the recent extreme bearish sentiment as very bullish for the market going forward into 2012. Remember, nothing is every 100% in trading or investing and history does not always repeat itself, although patterns often do.


