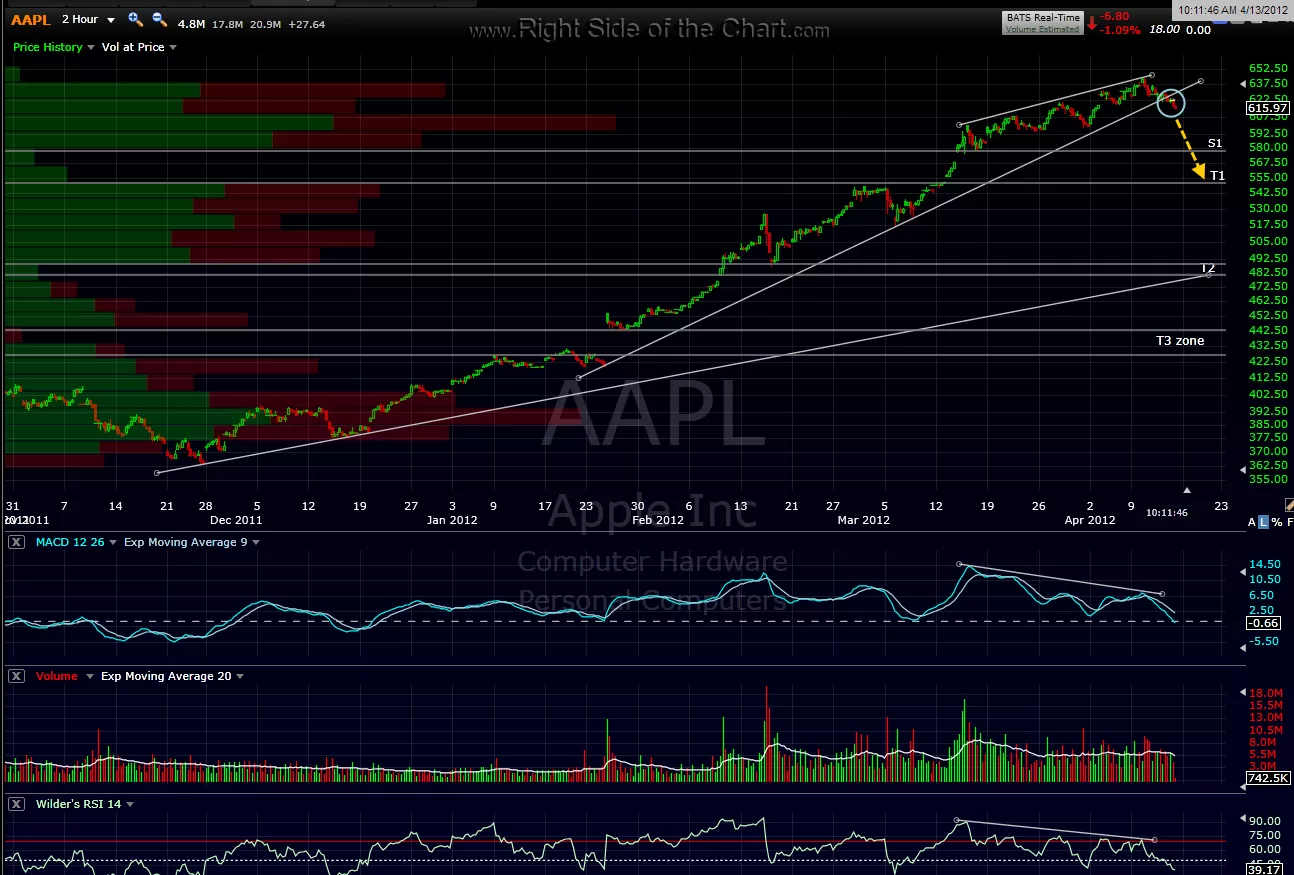
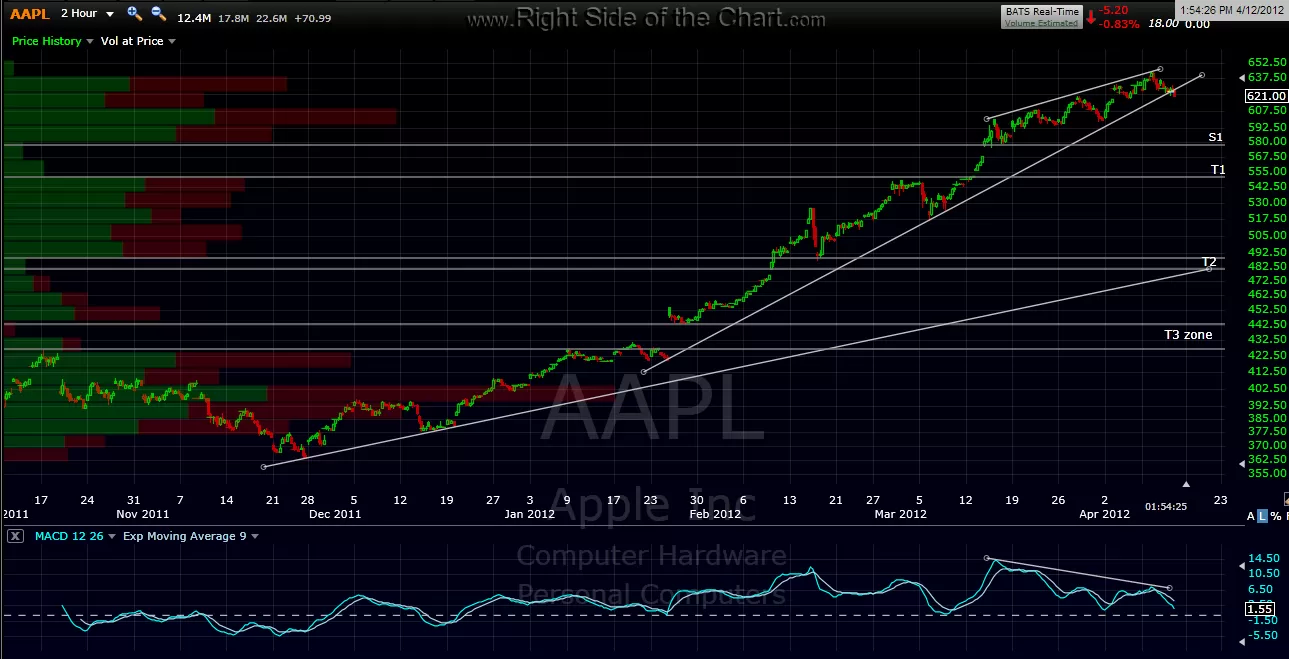
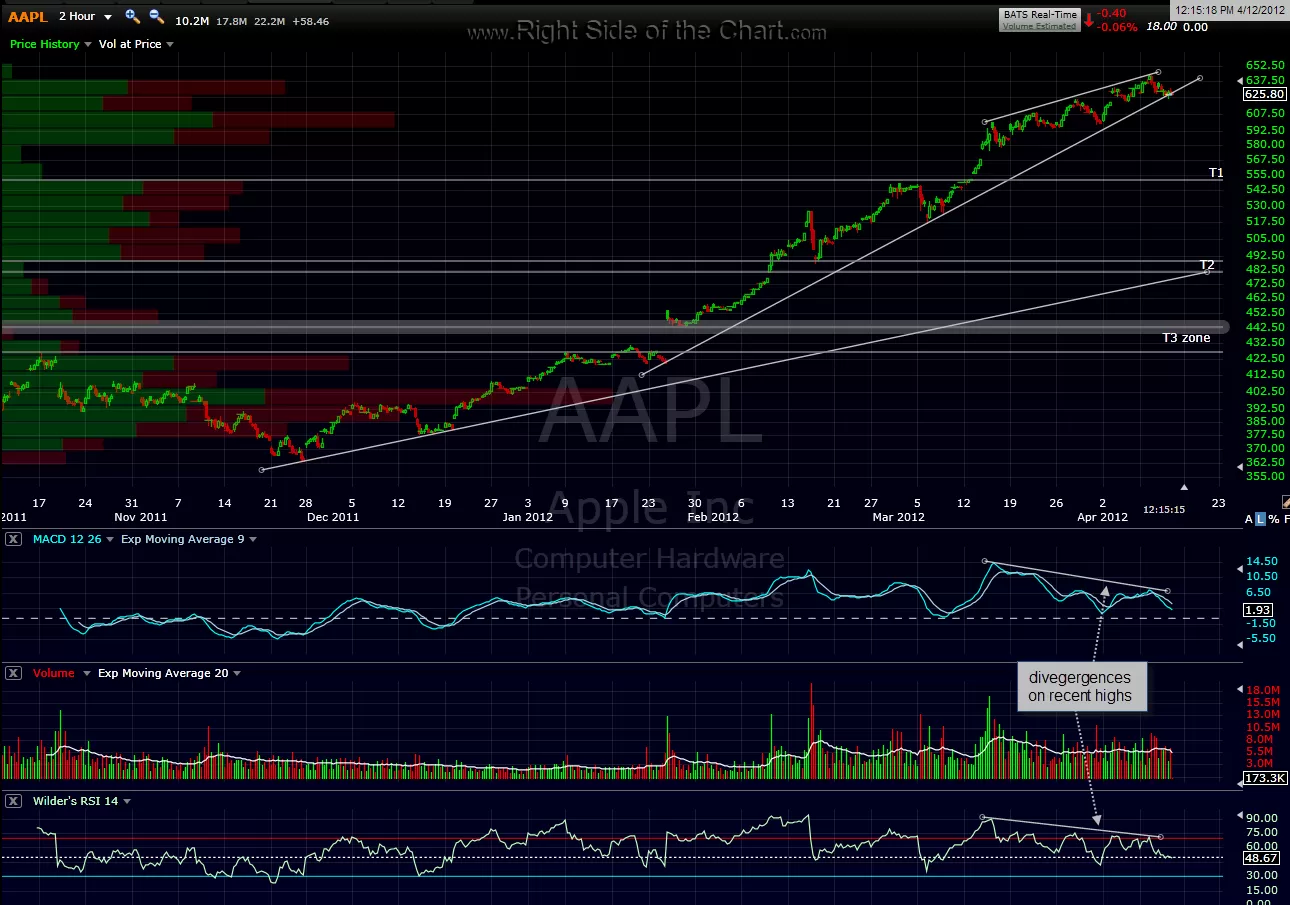
here’s the updated 120 min (2-hour period) chart of AAPL along with the previous 120 min charts behind it. looks like prices have clearly broken below the first uptrend line and although i said that a candlestick close below on the 4-hour chart would be the official sell signal, i’m just going to go ahead an make it an official short trade now. i’m not shorting it personally, at least not at this time but as i mentioned previously, i’m using select QQQ derivatives (QQQ puts and a TQQQ short) in lieu of AAPL but also as a play on the recent breakdown of the QQQ on the daily chart on april 4th.
again, consider AAPL an official short here at 615.97 with stops above the 634 level, or where ever your own preference is. i will also be out for a few hours at a business lunch meeting with someone who recently rolled out a trading software program which looks pretty interesting.
edit: remember, the yellow dashed arrow use here, and in most scenarios does not predict the exact price or time move that i expect. in fact, as i mentioned before when i added that S1 (1st support) level, i would expect a reaction (bounce or pause) off that level although i would expect it to be relatively short lived.