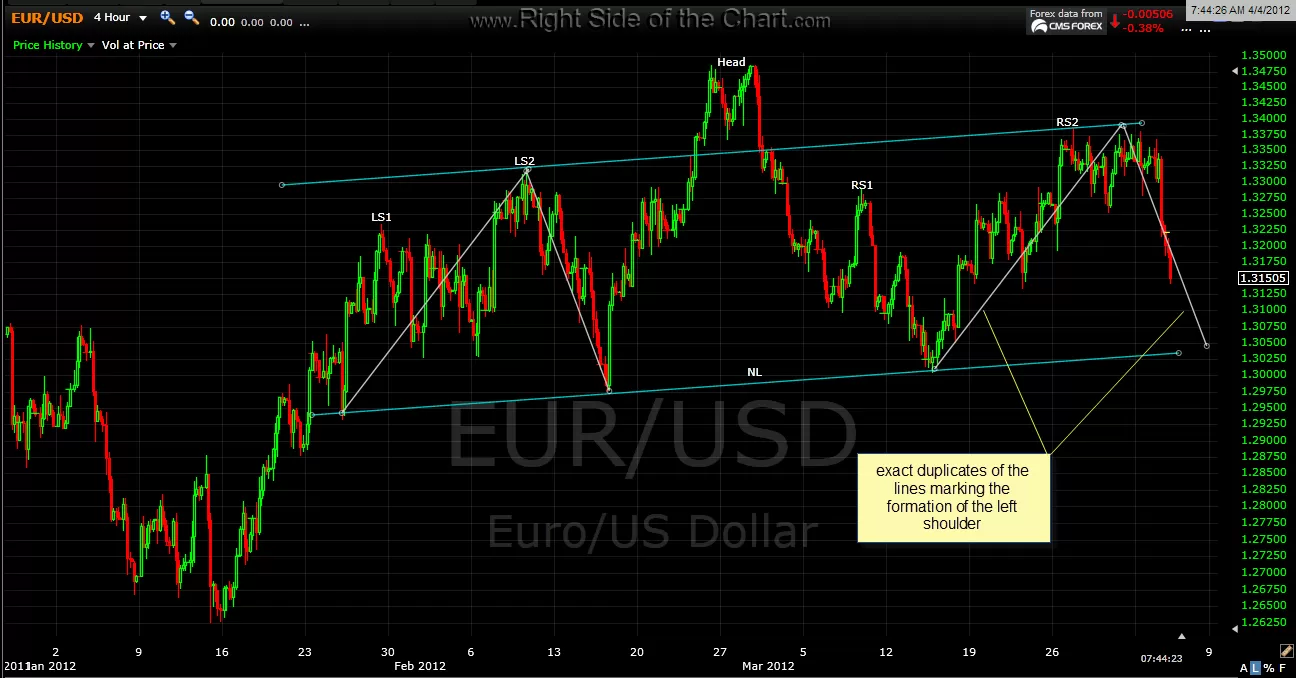
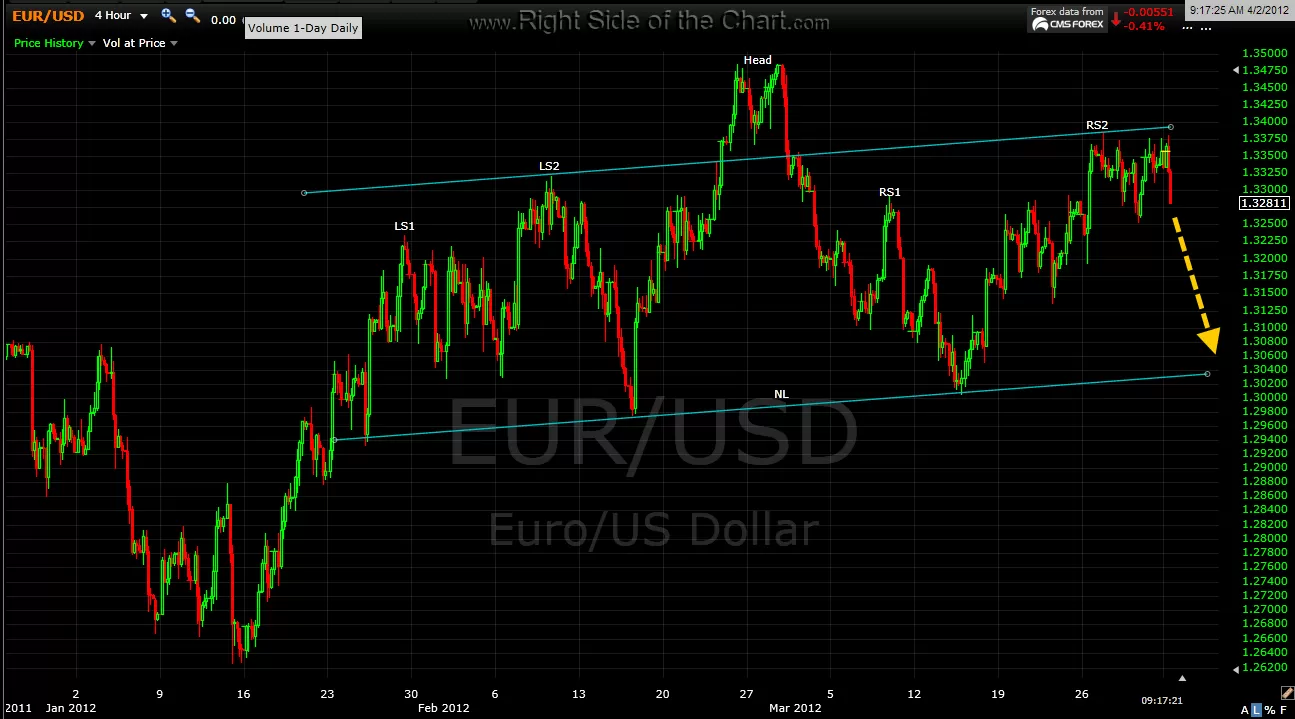
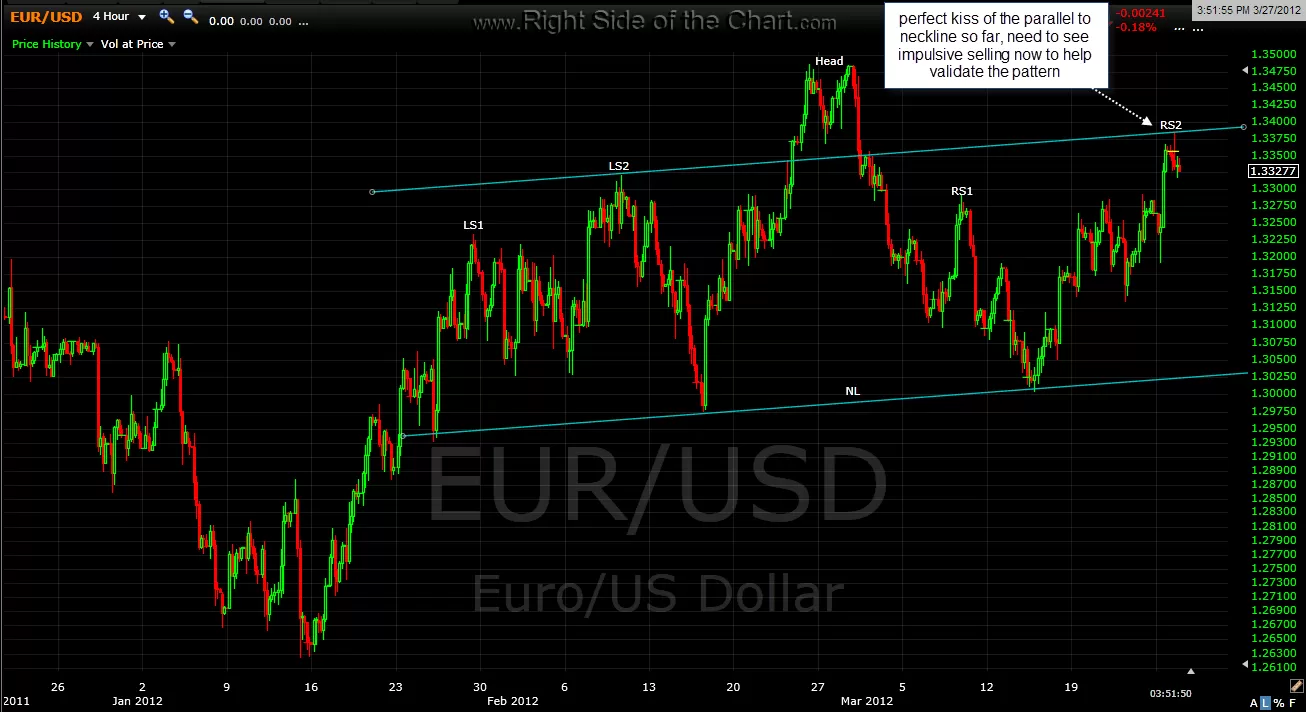
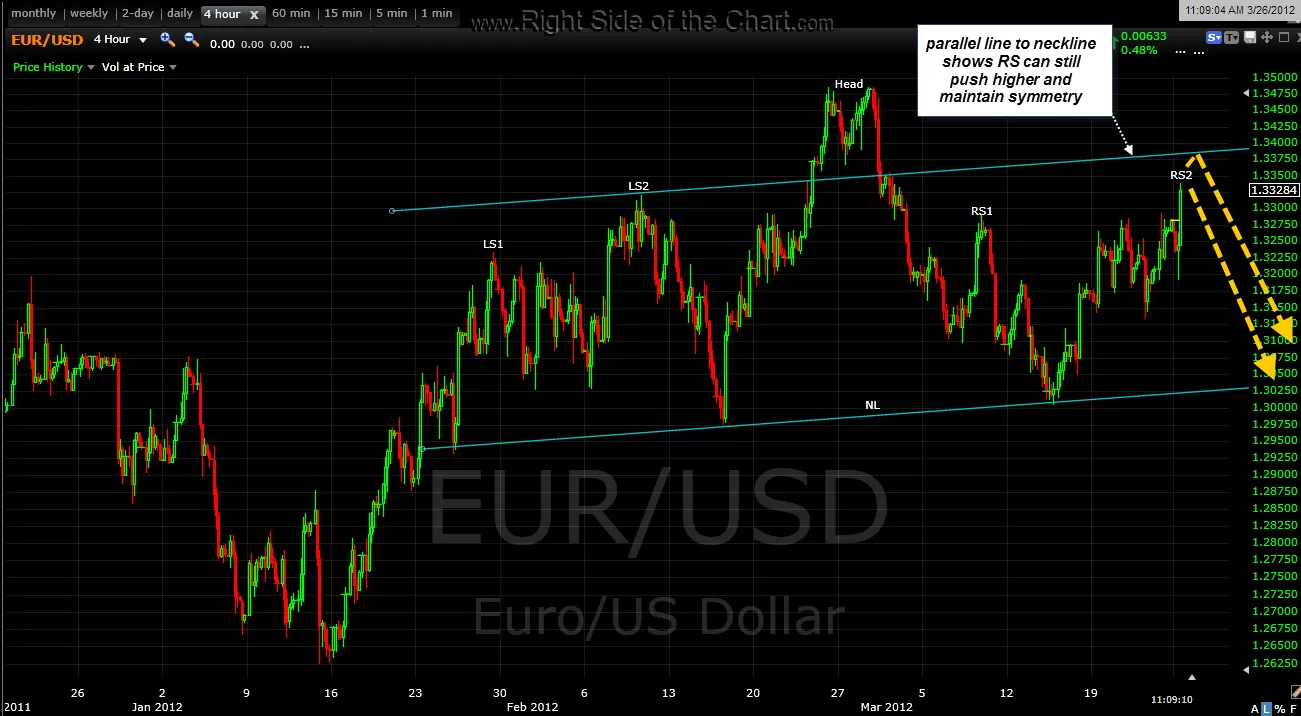
i actually added these lines to my 4 hr EUR/USD potential H&S pattern yesterday and so far, it continues to play out as per the pattern criteria with the impulsive selling off the top of the right shoulder. what i did was to use trendlines from the bottom and top of the left shoulder and then duplicate those lines and add them to the right shoulder (splitting the mid-point of the top of the shoulder) to come up with an estimate of when that pattern might be completed, assuming continued symmetry. of course this does not have to, nor will it play out exactly as before but it is important to realize that during corrections and sell-offs, prices usually move to the downside much faster than they rise during up-trends. charts in reverse chronological order (most recent first):
note: i labeled this pattern as complex (double-shouders) H&S pattern although it’s really not a true complex H&S as LS1 and RS1 don’t actually touch the neckline on both sides. i just did this to highlight the symmetry of those mini or sub-shoulders.