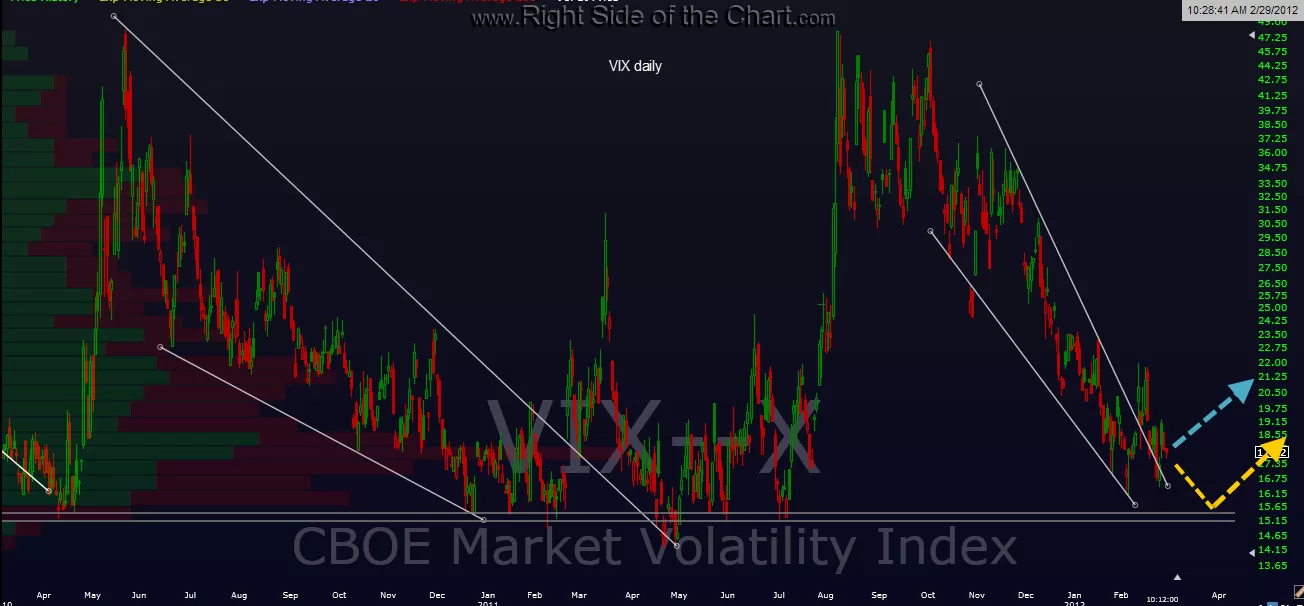
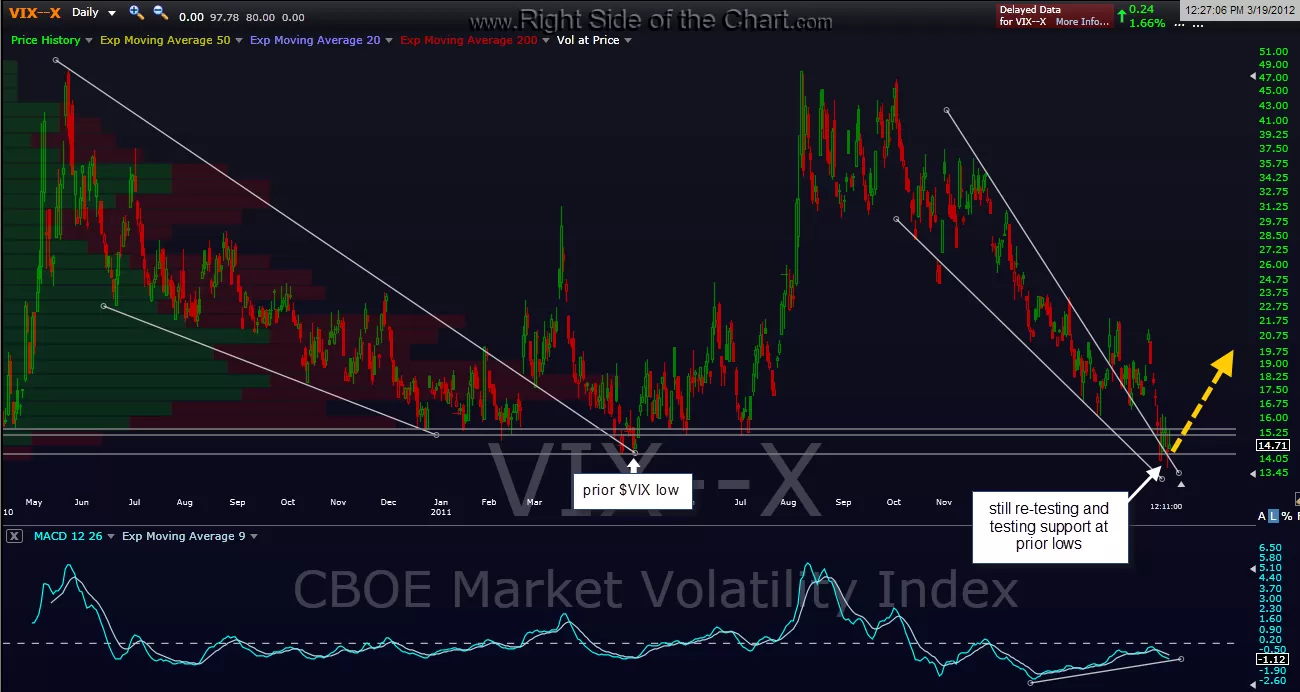
here’s the updated $VIX daily chart along with the previously posted chart. as you can see, the VIX is currently testing support at it’s multi-year lows as well as continuing to skirt down the falling wedge on what seems like a second re-test.

Results for {phrase} ({results_count} of {results_count_total})
Displaying {results_count} results of {results_count_total}