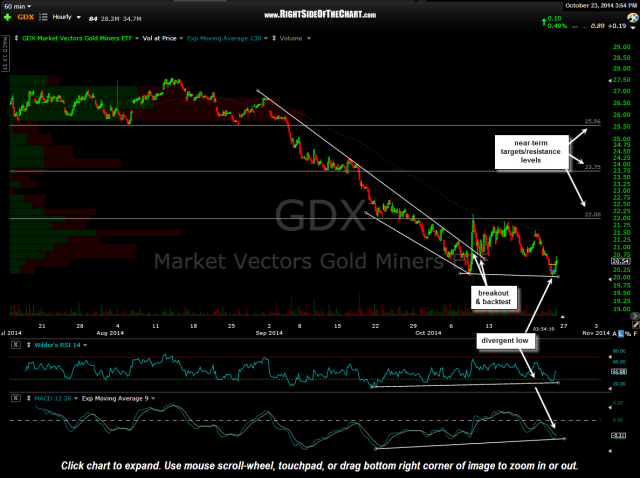
GDX (Gold Miners ETF) managed to claw its way into positive territory today (trading up as much a 1.3% at the highs today) to close up 0.59% after being down nearly 2% earlier today. One day does not make a trend but it could be an early start to a game of catch-up following the recently move higher in gold prices.
This is a 60 minute chart showing some near-term resistance levels which could also be used as price targets for a quick trade although my preference would be to see GDX take out the 22.00 resistance level (first horizontal line on this chart) as well as making sure that gold prices hold up (i.e.- don’t start moving much lower). GDX recently broke above a bullish falling wedge/slightly contracting descending channel, followed by a backtest of the channel with prices recent making a marginal new low while extending the positive divergences that were in place on both the MACD & RSI. Again, best to wait to see prices clear that 22ish resistance level before establishing or adding to any long position in GDX but if/when that level is taken out, the odds would favor a relative quick move up to the 23.75 level, about an 8% gain.


