I realized that for as long as yesterday’s commentary on the mining stocks was, I only shared my longer-term views on the sector and didn’t provide much in the way of thoughts on the near-term direction of the gold & silver miners. My opinion on the near-term direction has not changed much in the last few weeks. I have yet to add back exposure to the sector as I still believe the risk/reward for the near-term is not very favorable at this time and the chances for additional consolidation (i.e.-choppy, sideways price action) or even a decent correction remains elevated.
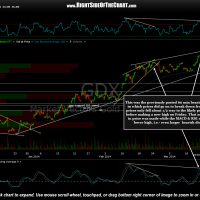
- GDX 60 minute March 17th
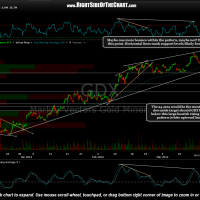
- GDX 60 minute March 19th
The previous & updated 60 minute charts above show that prices have now fallen to the bottom of the larger bearish rising wedge pattern (defined by the white uptrend lines). Although there is still a considerable amount of room within to the wedge (before the typically breakdown range) for prices to move higher, it would not surprise me to see prices break below the wedge very soon although I just don’t have a high degree of confidence on the near-term direction in the sector. The updated 60 minute chart lists several support levels below the wedge, should prices break down soon, including the first horizontal support not far below around 25.85ish. From there, the next support comes in around 24.75 and then 24.00, which would most likely be the final downside target on any healthy correction in the sector (that level also comes in around the 50% Fibonacci retracement of the move from the Dec 23rd lows to the recent March 13th peak). Again, my personal preference is to remain a spectator vs. a participant for now while waiting for an objective time to start adding back exposure to the sector but I just wanted to share this chart for those interested in actively trading the miners, long or short, at this time.
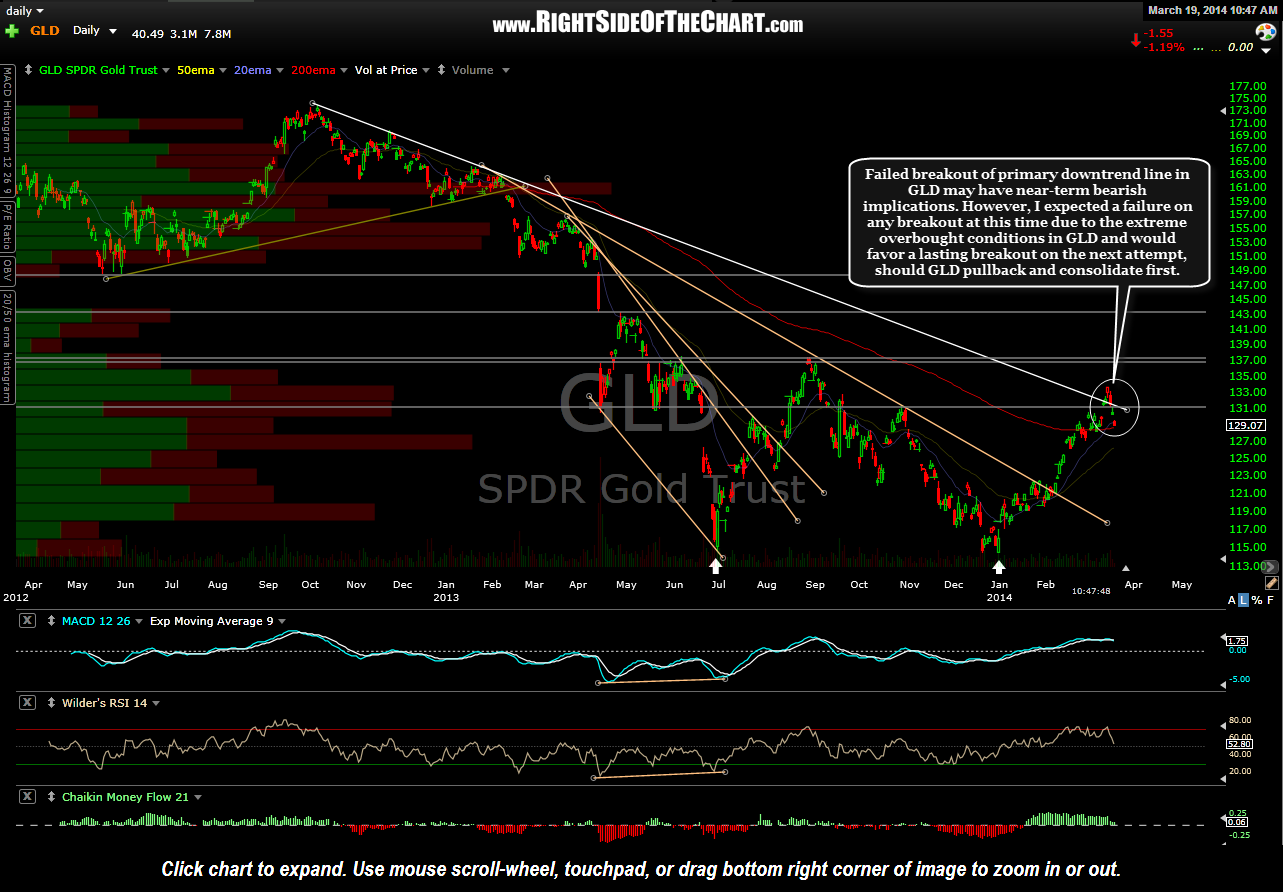
On a final note, I always incorporate the charts of $GOLD & GLD into my analysis of GDX as gold prices are clearly the driving force behind any rise or fall in the mining stocks. In yesterday’s commentary on the mining sector I mentioned the nearly unidirectional, very overbought run that the miners have experienced since the late December lows. Of course the same holds true for GLD as the move in gold prices has roughly mirrored the mining sector, with any pullbacks along the way virtually non-existent. As such, the odds that GLD is going to be able to punch right through this primary downtrend line (white) and continue higher without any decent pullback or consolidation first (in order to work off the overbought conditions) is very low IMO.
Due to the powerful momentum that was in place, GLD did manage to break and trade above the downtrend line for a couple of days but fell back below that key level yesterday and continues to move lower today. That failed breakout is what is commonly referred to as a bull trap and could have some near-term bearish implications for gold. My preferred scenario would be to see either some additional downside in both the metal & the miners and/or some consolidation in order to work off the overbought conditions before GLD makes another run at that downtrend line. Doing so would greatly increase the odds that the next breakout sticks and open the door for the next sustained advance in gold prices.


