honestly, as i’ve gone thru these charts i’ve tried to find as many objective long set-ups as possible but unfortunately (to those only interested in playing the long-side), it’s getting much more difficult as this market becomes so overbought. again, that is to find objective long entries, whereby the potential upside gain potential clearly outweighs the near-term downside risk. that doesn’t mean that the uptrend can’t or won’t continue up another 10% before a 10% correction in the marke, it just means that the charts, or more clearly my interpretation of them, do not put the odds in favor of it at this point in time.
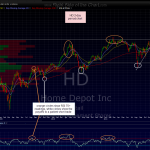
here’s a 2-day period chart of HD which looks like it will be a nice short if/when this uptrend line finally breaks, especially if we get a confirming signal from a cross back below 70 on the RSI 14 (2-day period, not daily). this chart clearly highlights the corrections that have always followed these 70+ readings in the past (at least the last 4 yrs shown here). of course, the overbought readings, or even a cross back below 70 is anything but an exact timing indicator. this trade might be best as a swing short entered in various lots (scaling in), with the first sell signal triggered on a break of the uptrend line.


