
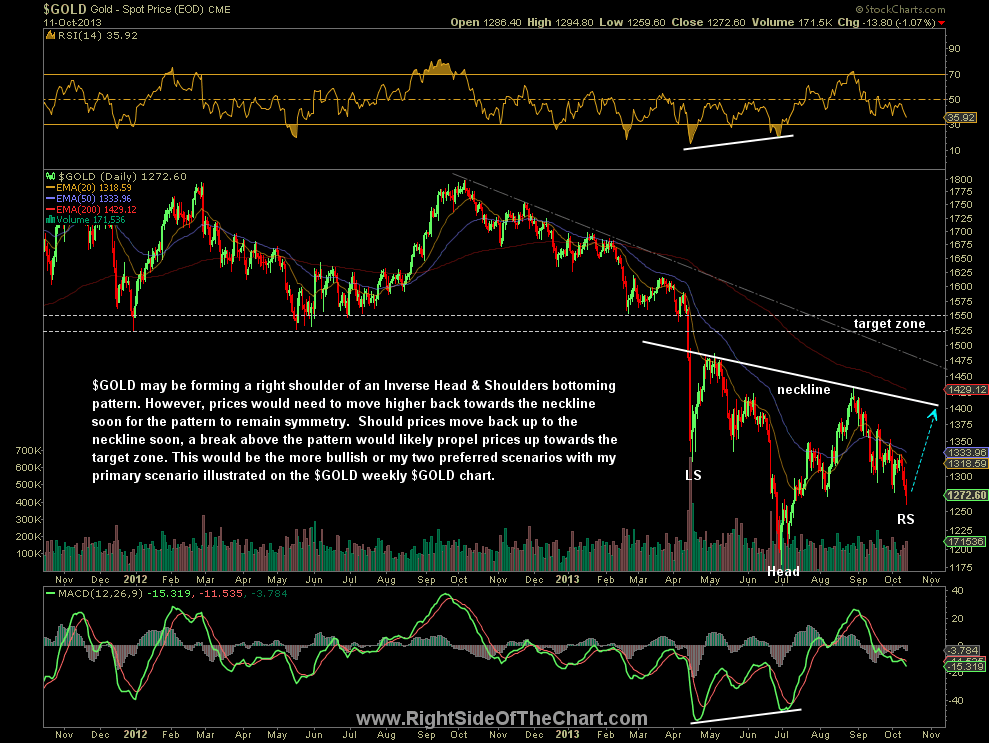
I’ve been planning on discussing my thoughts on gold/GLD via video format but with my efforts focused on the recent improvements to the site, I’m going to go ahead and share my thoughts along with my two preferred scenarios for the yellow metal. Starting with my alternative scenario as shown on the the daily chart below, $GOLD may be forming a right shoulder of an Inverse Head & Shoulders bottoming pattern. However, prices would need to move higher back towards the neckline soon in order for the pattern to retain its symmetry. Should prices move back up to the neckline soon, a break above the pattern would likely propel prices up towards the target zone. This would be the more near-term bullish of my two preferred scenarios with my primary scenario illustrated on the $GOLD weekly $GOLD chart.
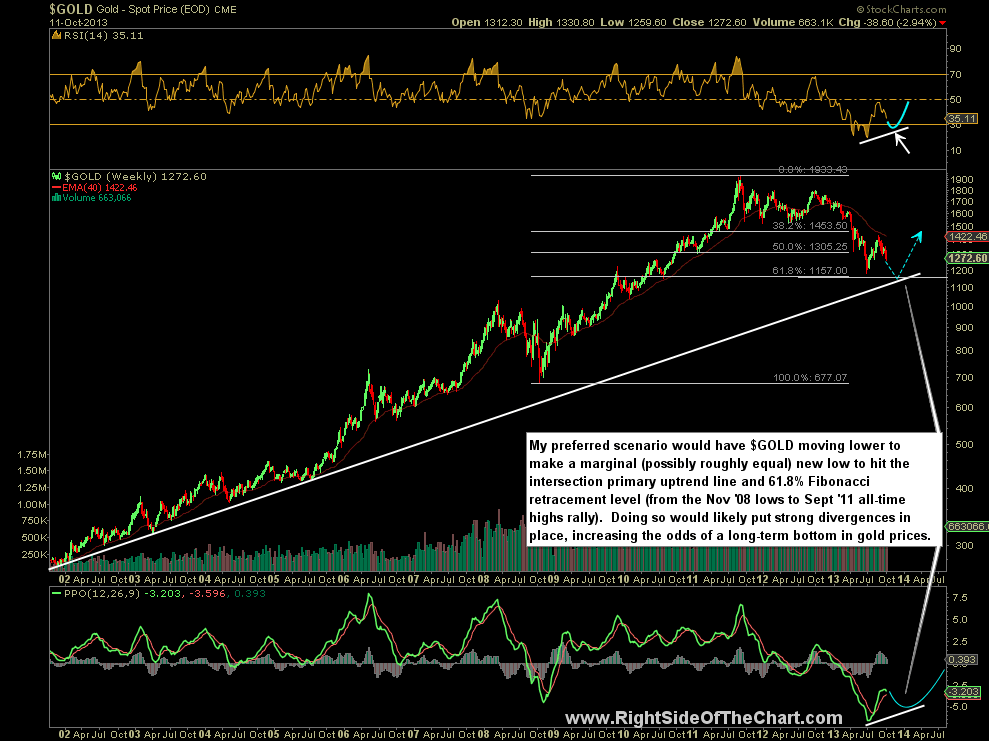
My preferred scenario, as shown on the weekly chart below, would have $GOLD moving lower to make a marginal (possibly roughly equal) new low to hit the intersection primary uptrend line and 61.8% Fibonacci retracement level (from the Nov ’08 lows to Sept ’11 all-time highs rally). Doing so would likely put strong divergences in place, increasing the odds of a long-term bottom in gold prices. Among other fundamental & technical factors, my reasoning for giving a higher weighting to the weekly scenario (one additional new low yet to come in gold) is the fact that such key a support level, such as this intersecting decade+ uptrend line and key Fib retracement level, will typically act as a magnet for prices… pulling in the stock (or in this case, gold prices) once they approach such support, especially after making such an extended run above the trendline. Additionally, lasting bottoms are often accompanied by positive divergences on the indicators and oscillators, as drawn in the scenario (blue lines) below.
Keep in mind that these preferred and alternative scenarios of just two of a myriad of possibilities. Even if one of these two scenarios are to play out, then how does one successfully position for it? For starters, let me be clear that although I prefer the weekly scenario (one additional new low), I only give that scenario a somewhat higher weighting. Although I haven’t bought back into any of the precious metals holdings that I sold on the huge post-Fed announcement rally back on Sept 18th, I still prefer a gradually scale-in method of accumulating various gold & silver stocks (GLD, SLV, GDX, SIL, and various individual miners). I’d like to see one of two things happen before adding back exposure to the sector: 1) Gold (and Silver) prices begin to start to move higher soon before going much lower, preferably on above average volume. If so, that would increase the odds that a right shoulder is forming on that potential H&S pattern on the daily time frame. 2) If prices continue to fall much lower, than the symmetry for the potential H&S pattern will no longer exist and the odds that my primary scenario (weekly) will begin to rapidly increase. If so, I will begin scaling back in as gold begins to approach the June 28th lows, with the intention of bringing my precious metals holdings to a full or near-full position given the properly signals on the short-term charts (daily, 60 minute, etc..), such as a bullish reversal candlestick printed on a high-volume sell-off accompanied by positive divergences on one or more time frames, etc… Links to the updated, annotated verisons of the charts above may now be found in the new Live Chart Links page.