With the new Live Chart Links located on the sidebar of the homepage of RSOTC, the need to post updated static charts and commentary on the major US indices can be reduced somewhat. Updates will still be made when the technical picture (or my targets/primary scenario) changes in addition to updates when prices are approaching important technical levels, such as support or resistance. Also keep in mind that only stockcharts.com subscribers will be able to view the live chart links in real-time whereas non-stockcharts.com members will only be able to view end-of-day data (i.e.- the previous closing values). Again, any significant developments will continue to be posted on the site using the static chart format as in the past.
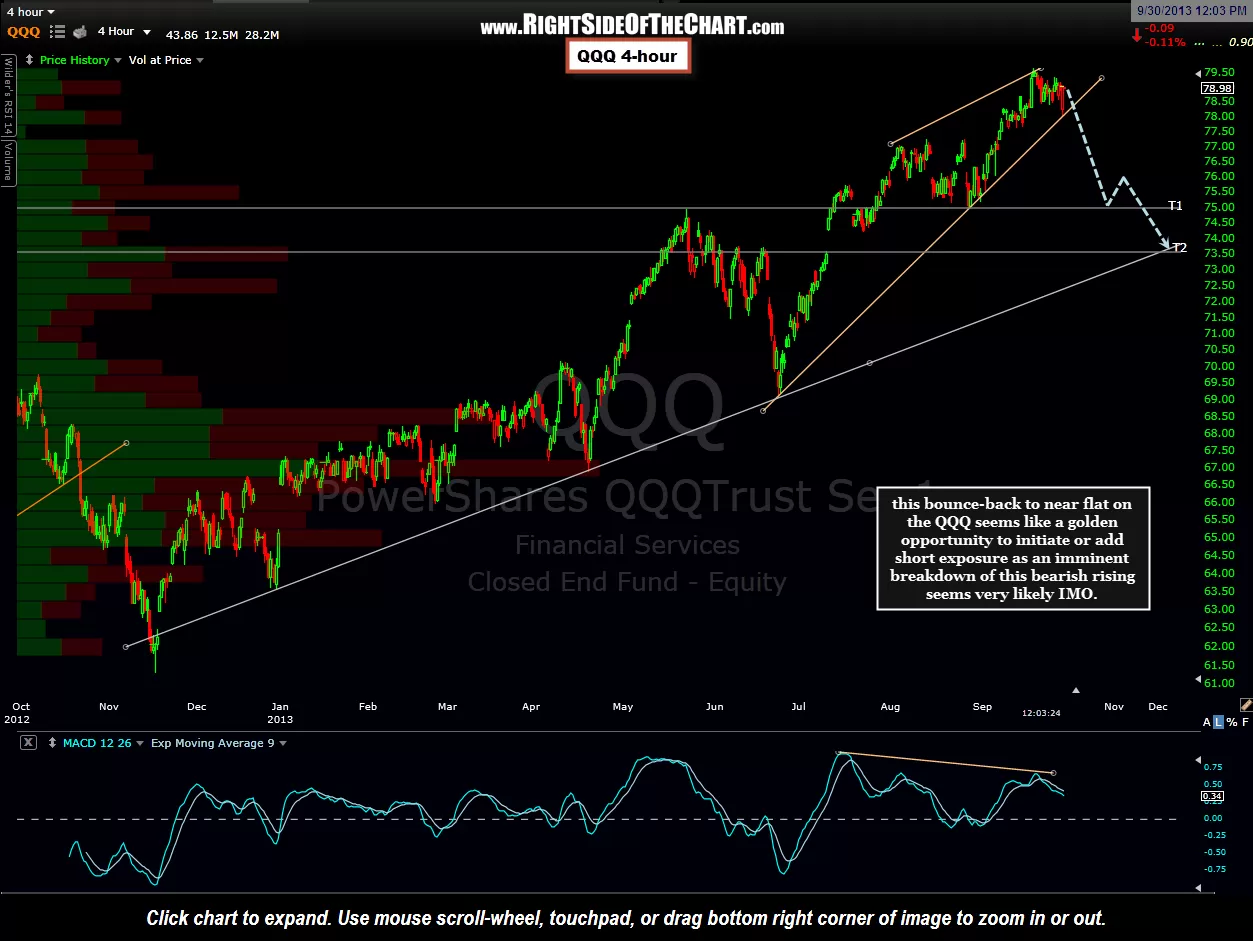
My focus right now will be on updating the most compelling/promising Active Trades and Setups along with finding some new trade ideas to add to the site. In keeping with my goal of providing streamlined market analysis (without a lot of extraneous commentary, opinions and other non-actionable chatter), I just wanted to reiterate that my current outlook for the market remains the same. On the Sept 30th post titled Shorting the Q’s, I stated: This bounce back to near flat on the QQQ seems like an objective opportunity to initiate or add short exposure as an imminent breakdown of this bearish rising seems very likely IMO. My expectations for the “fireworks” to begin this week far exceeds the ~1%ish gap down in the broad averages today but is more along the lines of a 5%+ drop over the next week or so (and likely then some from there).
From that point just 7 trading sessions ago, the Q’s have already fallen about 3% and with prices on all major US index now clearly trading below their bearish rising wedge patterns and my confidence in that statement remains very high. Remember, stock prices tend to fall much faster than they rise, especially when such clear bearish patterns with strong, long-standing divergences in place finally break down. Yes, the risk for a end-to-the-stalemate-in-Washington relief rally does exist but my opinion remains that the overwhelming bearish technicals on the charts will ultimately trump any bullish news-event driven pop in the equity markets. Being that prices have already fallen over 1/2 way to my first target and nearly a third of the way to the second target (on the daily QQQ chart), initiating short exposure on the broad market (via QQQ, QID, TWM, IWM etc…) is not nearly as objective as it was when those trades were initially added early last week. As such, my own preference is to focus on shorting the most attractive individual stock trade ideas vs. adding any more exposure to my broad market shorts at this point (i.e.- short stocks, not the market).
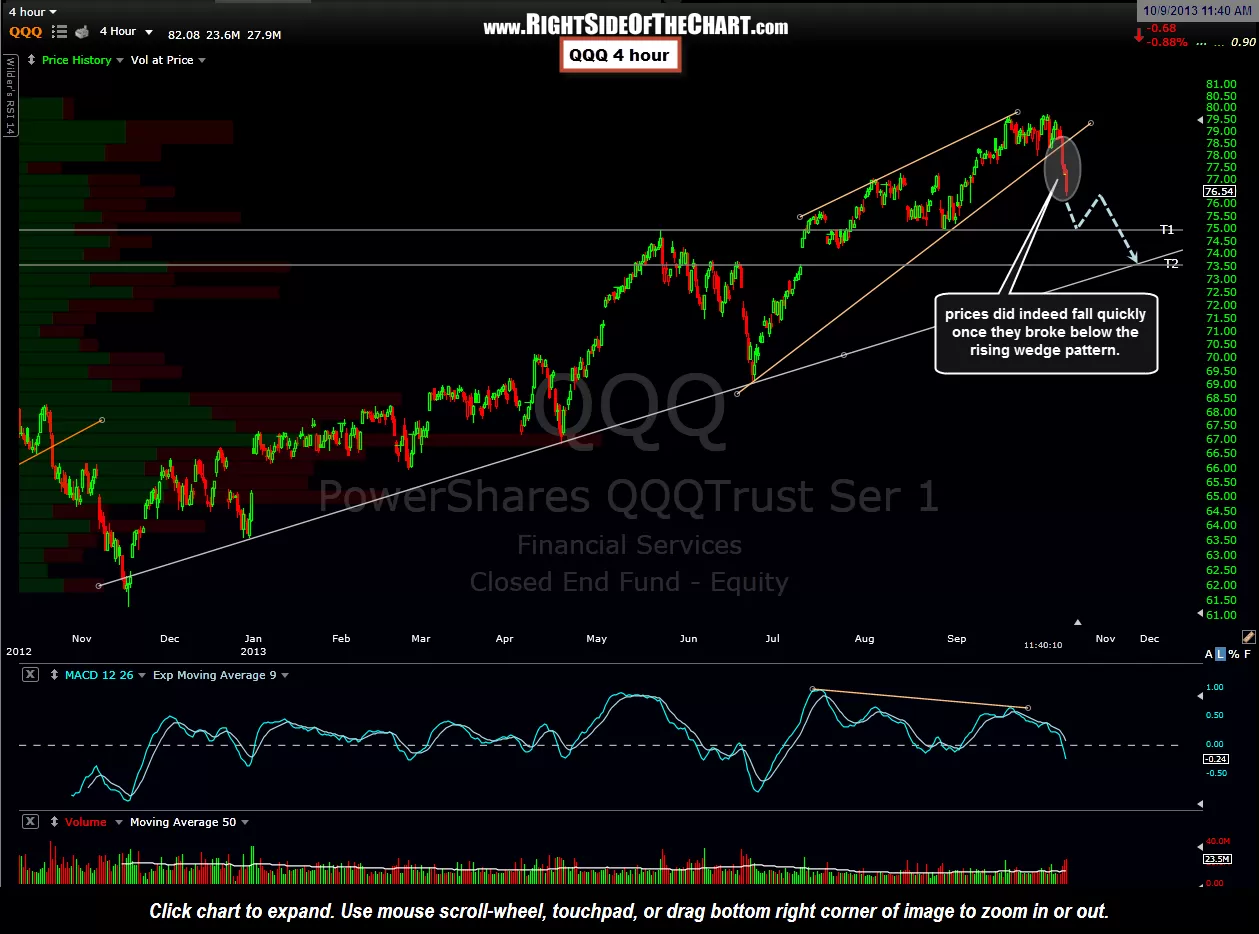
For those who are not comfortable with shorting stocks or using the inverse ETFs as pure short plays or hedges to a portfolio of long positions, just make sure to have an exit plan on your current holdings, including both stops and profit targets. If there are any trade ideas from the site that you are currently following and would like an updated chart or opinion, please use the Contact link under the Resources tab at the top of the page & I will do my best to email you or post and updated chart on the site. Below are the previous and updated 4-hour charts for the QQQ. Keep in mind that the bounce or squiggle drawn on the scenario (blue dashed lines) is only a rough estimate of the scope and duration of the expected bounce off of the first target level. In fact, I would probably give the odds to a much smaller reaction (bounce) and could easily see prices slicing right through T1 before finding any significant support at the T2 level.
-
- Sept 30th QQQ 4-hour chart
-
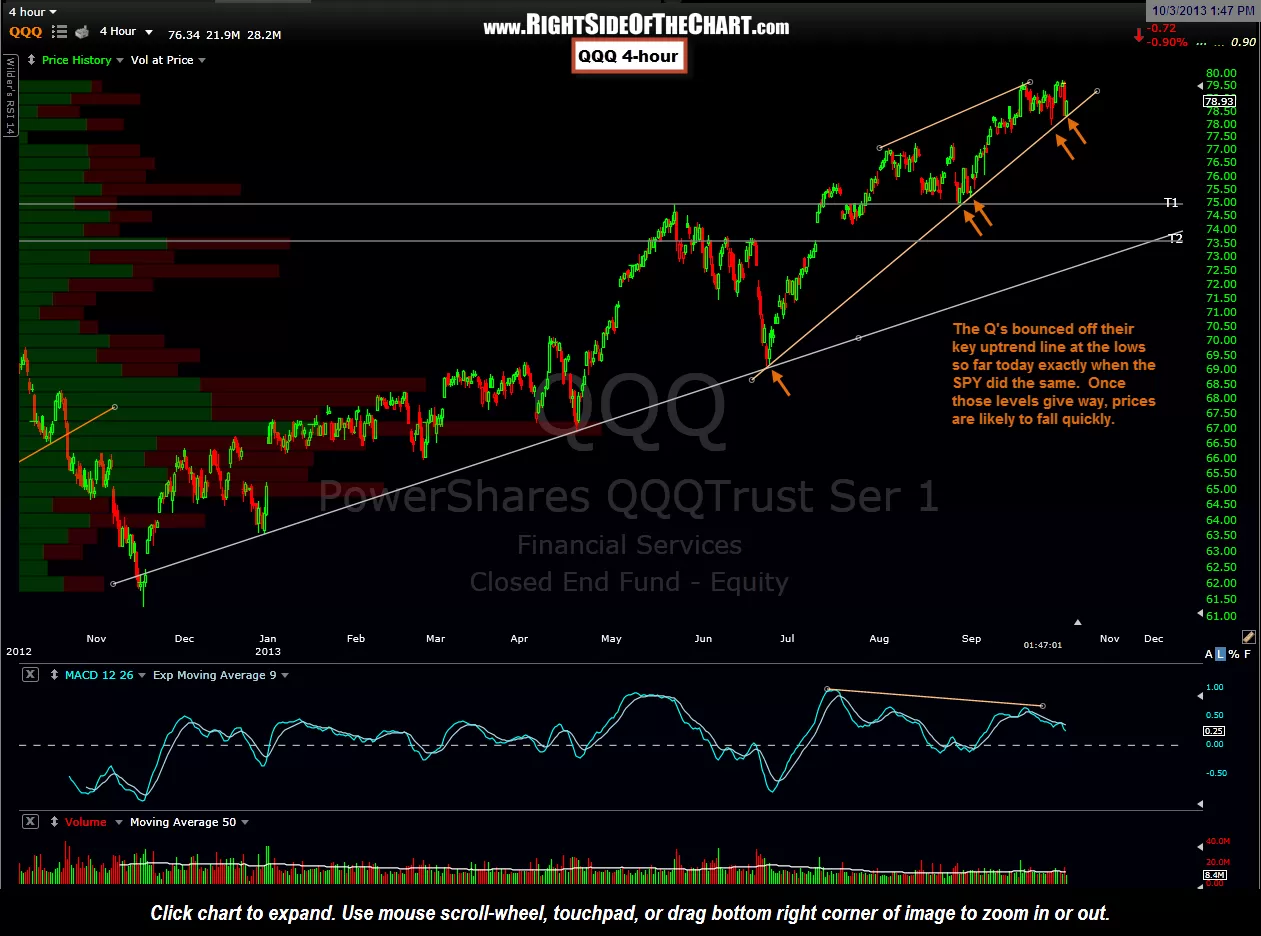
- Oct 3rd QQQ 4-hour chart
-
- Updated QQQ 4-hour chart