
To say that I am disappointed in my recent market analysis and overall returns (or lack thereof) in my trading account over the last couple of weeks would be a gross understatement. This market continue to climb in spite of what was, at least by my interpretation, some clearly bearish technicals and other metrics that pointed to a correction much deeper than the relatively shallow pullback that we experiences a couple of weeks ago. Part of trading successfully is the ability to admit when you are wrong and make the appropriate adjustments asap in order to mitigate losses and re-position according in-line with the most likely future direction of the market (or your individual positions).
With that being said, although the recent price action has had a more bullish undertone (positive breadth, many recently bearish pattern breakdowns reversed shortly after triggering, resistance level after resistance level being taken out with minimal effort, etc…), I am still leaning toward the bearish scenario that will soon take prices back below the recent Aug 28th lows. As stated earlier, every tick above that 60 minute downtrend line that was recently taken out rapidly chips away at the bearish scenario but as of now, my take is this:
The SPX and every other major US index that I track other than the $NDX has yet to make a new high since peaking over 5 weeks ago. Bearish divergences remain in place and until/unless all the major averages, particularly those that include all sectors of the US economy (unlike the tech heavy and financials excluded $NDX), I am viewing the recent rally as an counter-trend bounce in a new intermediate-term downtrend. Again, that view is rapidly diminishing with every tick higher from here but for now remains my preferred scenario. (previous & updated QQQ daily charts below):
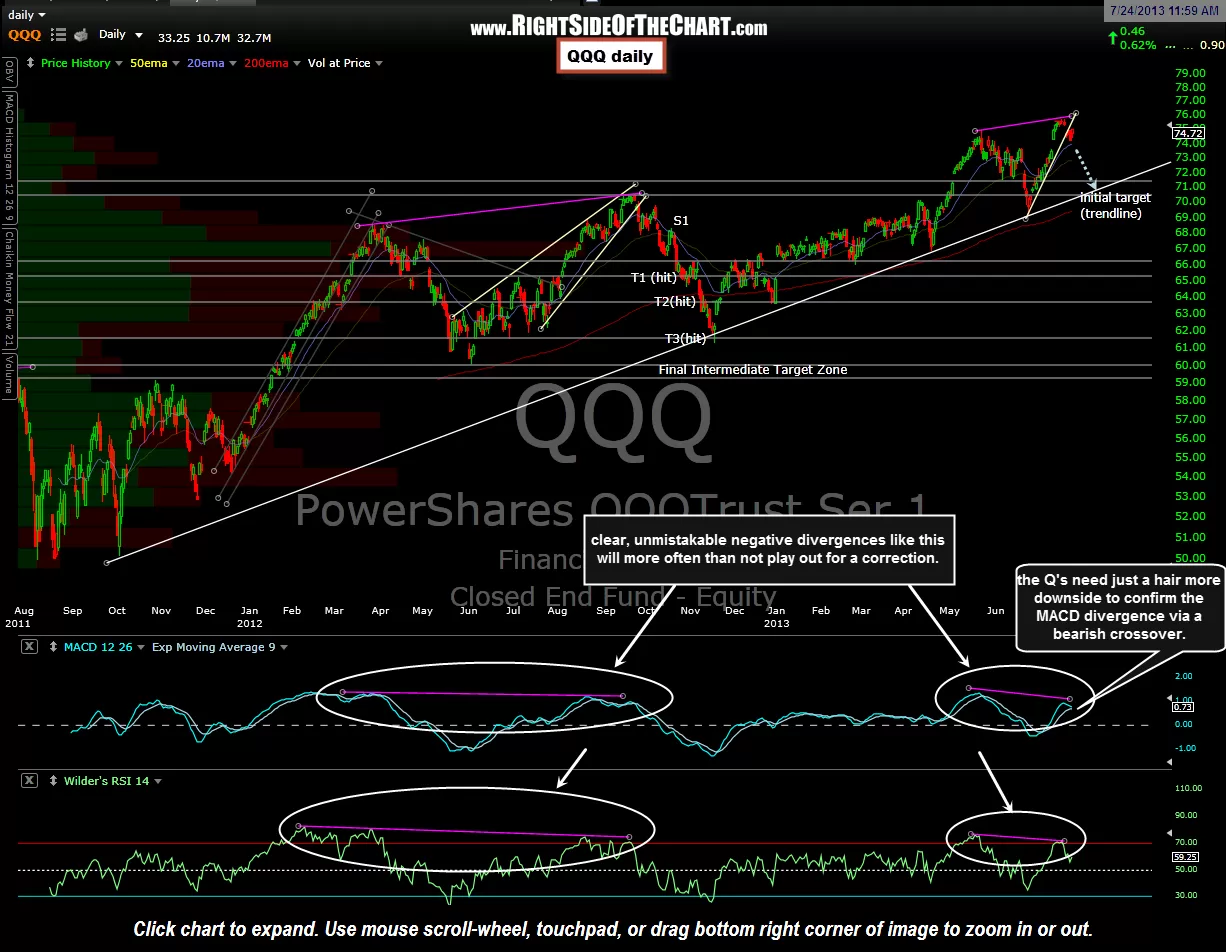
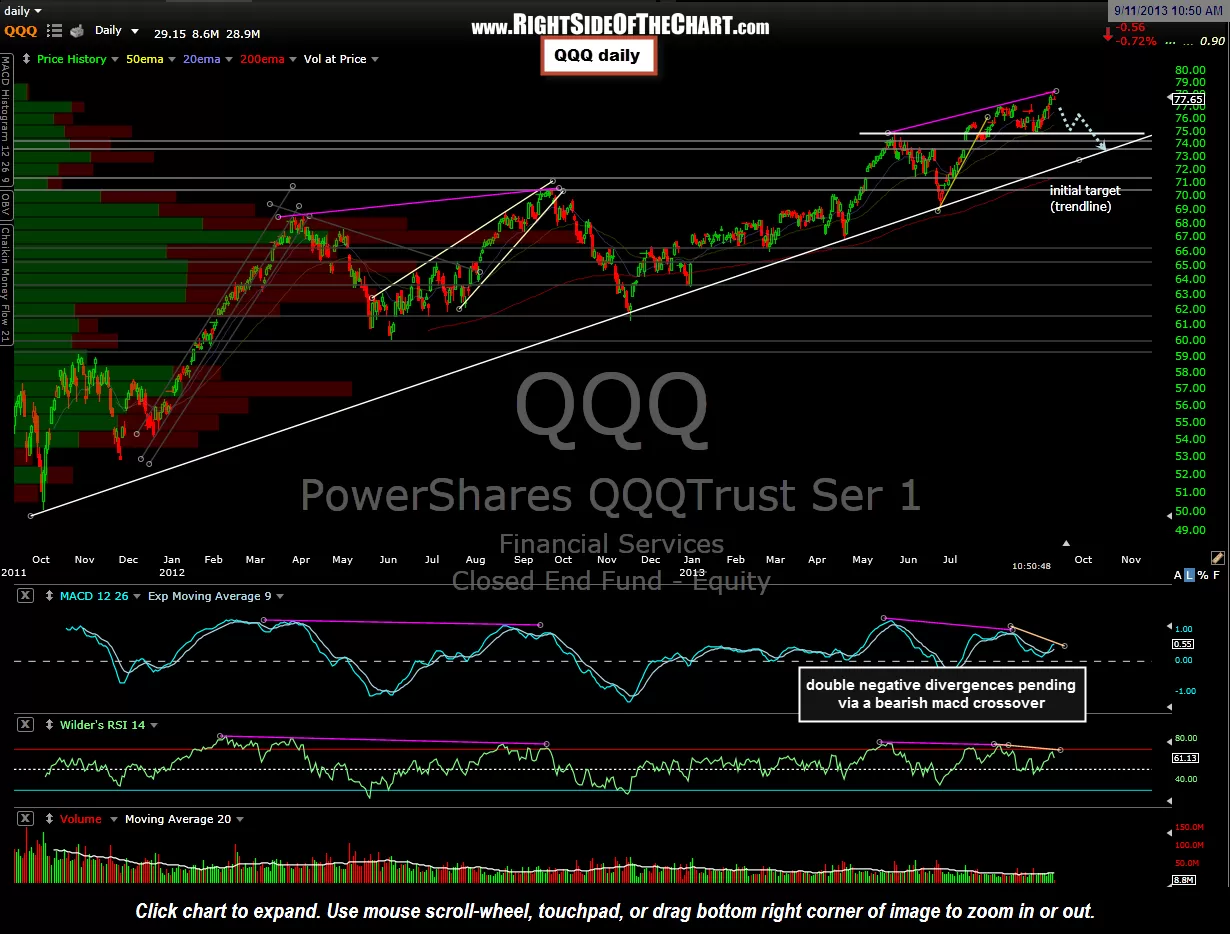
With the fact that the $NDX is the only major US index recently making a new high (the Dow, Russell 2k, Midcaps, and S&P 500 have not), it is worth noting that the recent thrust to new highs on the $NDX has formed potential double negative divergence on most key indicators, including the MACD and RSI. What this means is that multi-month divergences were already in place on the Aug 13th highs in the $NDX (I’m using the QQQ as the proxy for the charts here) with the MACD & RSI forming and even lower low on the most recent thrust to new highs in the index.
Yes, negative divergences can be burned through if prices continue to power high but more often than not, they play out for at least a modest correction. My plan, therefore, is to hold tight on my overall net-short positioning for now with the intention of starting to reduce overall market exposure (both long and short) if prices do continue to move higher from here. I’ll also be more apt to move towards cash or market neutral than towards and overall net-long positioning as there are still several recent red flags that have developed as the markets hover near multi-year highs (AAII bull-bear spread sell signal confirmed, several recent Hindenburg Omen signals triggered, multi-year low short interest and other complacency measures, etc…).